Chromosomal Theory and Genetic Linkage
By the end of this section, you will be able to:
- Discuss Sutton’s Chromosomal Theory of Inheritance
- Describe genetic linkage
- Explain the process of homologous recombination, or crossing over
- Describe chromosome creation
- Calculate the distances between three genes on a chromosome using a three-point test cross
Long before scientists visualized chromosomes under a microscope, the father of modern genetics, Gregor Mendel, began studying heredity in 1856. (Source note: the source says 1843; this book’s own Mendel chapter dates the start of his decade-long inheritance research to 1856, and the year here follows it.) With improved microscopic techniques during the late 1800s, cell biologists could stain and visualize subcellular structures with dyes and observe their actions during cell division and meiosis. With each mitotic division, chromosomes replicated, condensed from an amorphous (no constant shape) nuclear mass into distinct X-shaped bodies (pairs of identical sister chromatids), and migrated to separate cellular poles.
Chromosomal Theory of Inheritance
The speculation that chromosomes might be the key to understanding heredity led several scientists to examine Mendel’s publications and reevaluate his model in terms of chromosome behavior during mitosis and meiosis. In 1902, Theodor Boveri observed that proper sea urchin embryonic development does not occur unless chromosomes are present. That same year, Walter Sutton observed chromosome separation into daughter cells during meiosis. Together, these observations led to the Chromosomal Theory of Inheritance, which identified chromosomes as the genetic material responsible for Mendelian inheritance.
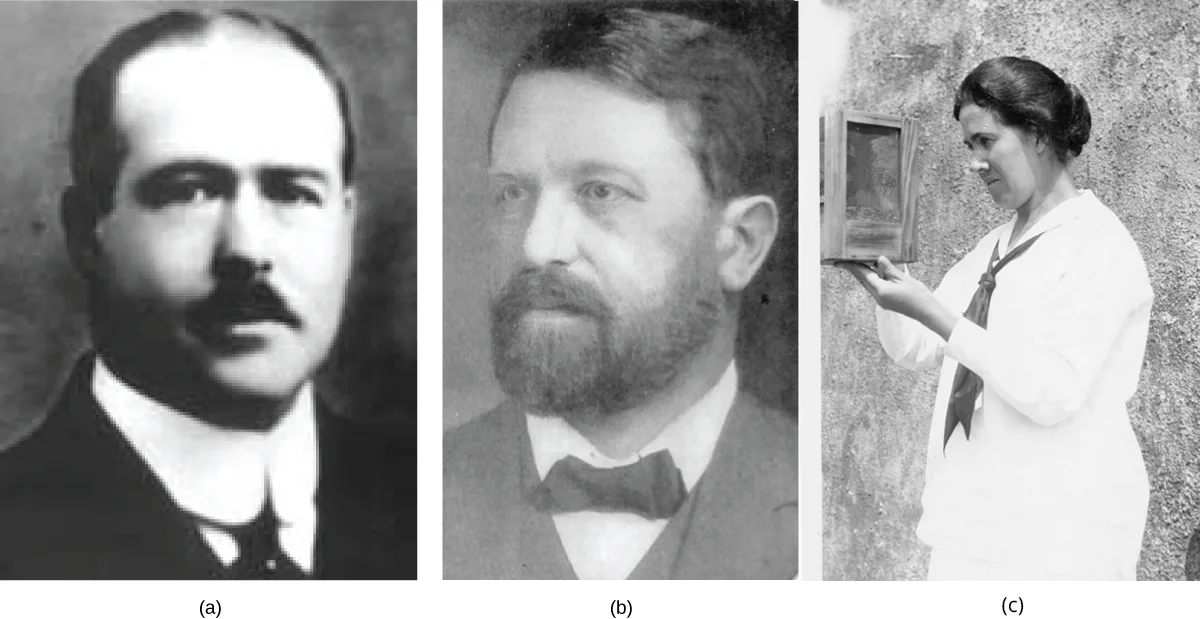
The Chromosomal Theory of Inheritance was consistent with Mendel’s laws, which the following observations supported:
- During meiosis, homologous chromosome pairs migrate as discrete structures that are independent of other chromosome pairs.
- Chromosome sorting from each homologous pair into pre-gametes appears to be random.
- Each parent synthesizes gametes that contain only half their chromosomal complement.
- Even though male and female gametes (sperm and egg) differ in size and morphology, they have the same number of chromosomes, suggesting equal genetic contributions from each parent.
- The gametic chromosomes combine during fertilization to produce offspring with the same chromosome number as their parents.
Despite the lack of direct evidence that chromosomes carry traits, the compelling correlation between chromosome behavior during meiosis and Mendel’s abstract laws led scientists to propose the Chromosomal Theory of Inheritance. Critics pointed out that individuals had far more independently segregating traits than they had chromosomes. About ten years after the theory was proposed, Eleanor Carothers was the first to discover physical evidence supporting it; she observed independent chromosome assortment in grasshoppers. Then, after several years of carrying out crosses with the fruit fly, Drosophila melanogaster, Thomas Hunt Morgan provided additional experimental evidence to support the Chromosomal Theory of Inheritance.
Genetic Linkage and Distances
Mendel’s work suggested that traits are inherited independently of each other. Morgan identified a 1:1 correspondence between a segregating trait and the X chromosome, suggesting that random chromosome segregation was the physical basis of Mendel’s model. This also demonstrated that linked genes disrupt Mendel’s predicted outcomes. That each chromosome can carry many linked genes explains how individuals can have many more traits than they have chromosomes. However, researchers in Morgan’s laboratory suggested that alleles positioned on the same chromosome were not always inherited together. During meiosis, linked genes somehow became unlinked.
Homologous Recombination
In 1909, Frans Janssens observed chiasmata—the point at which chromatids are in contact with each other and may exchange segments—prior to the first meiotic division. He suggested that alleles become unlinked and chromosomes physically exchange segments. As chromosomes condensed and paired with their homologs, they appeared to interact at distinct points. Janssens suggested that these points corresponded to regions in which chromosome segments exchanged. We now know that the pairing and interaction between homologous chromosomes, or synapsis, does more than simply organize the homologs for migration to separate daughter cells. When synapsed, homologous chromosomes undergo reciprocal physical exchanges at their arms in homologous recombination, or more simply, “crossing over.”
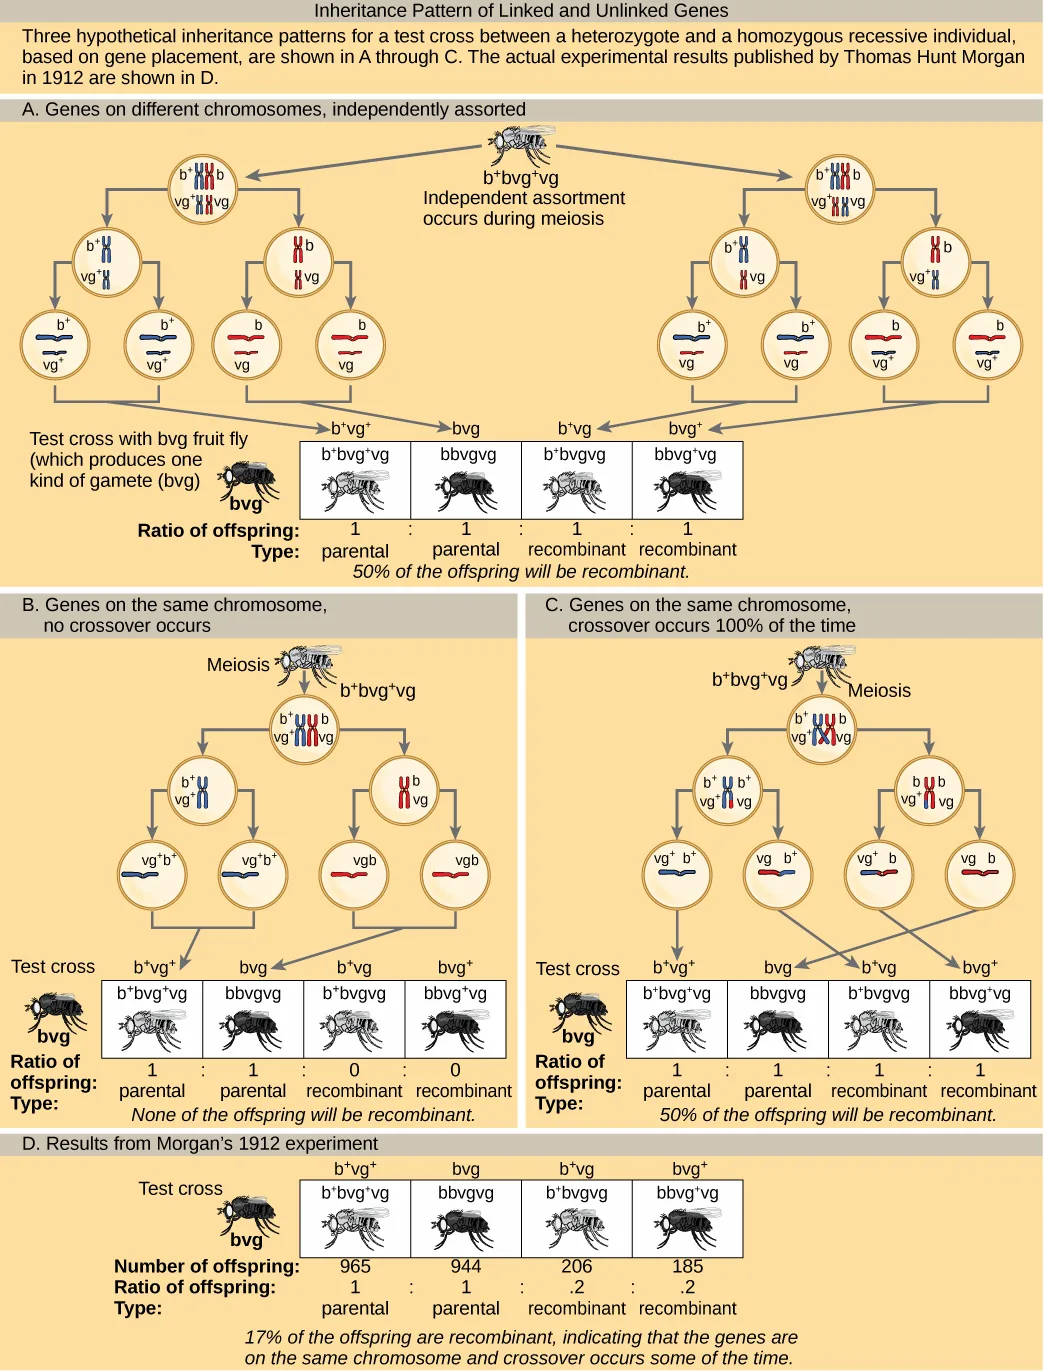
To better understand the type of experimental results that researchers were obtaining at this time, consider a heterozygous individual that inherited dominant maternal alleles for two genes on the same chromosome (such as A and B) and two recessive paternal alleles for those same genes (such as a and b). If the genes are linked, one would expect this individual to produce gametes that are either AB or ab with a 1:1 ratio. If the genes are unlinked, the individual should produce AB, Ab, aB, and ab gametes with equal frequencies, according to the Mendelian concept of independent assortment. Because they correspond to new allele combinations, the genotypes Ab and aB are nonparental types that result from homologous recombination during meiosis. Parental types are progeny that exhibit the same allelic combination as their parents. Morgan and his colleagues, however, found that when they test crossed such heterozygous individuals to a homozygous recessive parent (AaBb × aabb), both parental and nonparental cases occurred. For example, 950 offspring might be recovered that were either AaBb or aabb, but 50 offspring would also result that were either Aabb or aaBb. These results suggested that linkage occurred most often, but a significant minority of offspring were the products of recombination.
One of the experiments in Morgan’s lab involving the crosses of flies for two traits, body color (gray or black) and wing shape (normal and vestigial), demonstrated the recombination events that lead to the development of nonparental phenotypes.
Extended description
Panel A, ‘Genes on different chromosomes, independently assorted’: a heterozygous fly of genotype b⁺bvg⁺vg undergoes meiosis, producing four gamete types (b⁺vg⁺, bvg, b⁺vg, bvg⁺); each is crossed to a bvg test-cross fly to give four offspring boxes in a 1:1:1:1 ratio, two boxes labeled parental type and two labeled recombinant type, with a note reading ‘50% of the offspring will be recombinant.’ Panel B, ‘Genes on the same chromosome, no crossover occurs’: the same heterozygote’s meiosis yields only two gamete types, b⁺vg⁺ and bvg, giving four test-cross offspring boxes in a 1:1:0:0 ratio, with a note reading ‘None of the offspring will be recombinant.’ Panel C, ‘Genes on the same chromosome, crossover occurs 100% of the time’: meiosis with crossing over yields all four gamete types, giving offspring boxes in a 1:1:1:1 ratio, with a note reading ‘50% of the offspring will be recombinant.’ Panel D, ‘Results from Morgan’s 1912 experiment’: the same four test-cross offspring classes are shown with observed counts 965, 944, 206, and 185, and a note reading ‘17% of the offspring are recombinant, indicating that the genes are on the same chromosome and crossover occurs some of the time.’
In a test cross for two characteristics such as the one here, can the recombinant offspring’s predicted frequency be 60 percent? Why or why not?
Show model answer
Did your answer mention:
Genetic Maps
Janssens did not have the technology to demonstrate crossing over so it remained an abstract idea that scientists did not widely believe. Scientists thought chiasmata were a variation on synapsis and could not understand how chromosomes could break and rejoin. Yet, the data were clear that linkage did not always occur. Ultimately, it took a young undergraduate student and an “all-nighter” to mathematically elucidate the linkage and recombination problem.
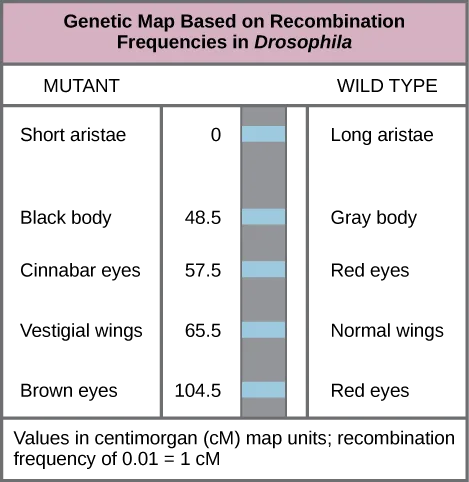
In 1913, Alfred Sturtevant, a student in Morgan’s laboratory, gathered results from researchers in the laboratory, and took them home one night to mull them over. By the next morning, he had created the first “chromosome map,” a linear representation of gene order and relative distance on a chromosome.
Extended description
Top to bottom along the map: short/long aristae length at 0 cM; black/gray body color at 48.5 cM; cinnabar/red eye color at 57.5 cM; vestigial/normal wing length at 65.5 cM; brown/red eye color at 104.5 cM. A note below the map states that a recombination frequency of 0.01 corresponds to 1 cM.
Which of the following statements is true?
Genes farther apart on the map recombine more often; compare each pair’s distance along the chromosome bar.As the genetic map above shows, by using recombination frequency to predict genetic distance, we can infer the relative gene order on chromosome 2. The values represent map distances in centimorgans (cM), which correspond to recombination frequencies (in percent). Therefore, the genes for body color and wing size were 65.5 − 48.5 = 17 cM apart, indicating that the maternal and paternal alleles for these genes recombine in 17 percent of offspring, on average.
To construct a chromosome map, Sturtevant assumed that genes were ordered serially on threadlike chromosomes. He also assumed that the incidence of recombination between two homologous chromosomes could occur with equal likelihood anywhere along the chromosome’s length. Operating under these assumptions, Sturtevant postulated that alleles that were far apart on a chromosome were more likely to dissociate during meiosis simply because there was a larger region over which recombination could occur. Conversely, alleles that were close to each other on the chromosome were likely to be inherited together. The average number of crossovers between two alleles—that is, their recombination frequency—correlated with their genetic distance from each other, relative to the locations of other genes on that chromosome. Considering the example cross between AaBb and aabb above, we could calculate the recombination’s frequency as 50/1000 = 0.05. That is, the likelihood of a crossover between genes A/a and B/b was 0.05, or 5 percent. Such a result would indicate that the genes were definitively linked, but that they were far enough apart for crossovers to occasionally occur. Sturtevant divided his genetic map into map units, or centimorgans (cM), in which a 0.01 recombination frequency corresponds to 1 cM.
By representing alleles in a linear map, Sturtevant suggested that genes can range from linking perfectly (recombination frequency = 0) to unlinking perfectly (recombination frequency = 0.5) when genes are on different chromosomes or genes separate very far apart on the same chromosome. Perfectly unlinked genes correspond to the frequencies Mendel predicted to assort independently in a dihybrid cross. A 0.5 recombination frequency indicates that 50 percent of offspring are recombinants and the other 50 percent are parental types. That is, every type of allele combination is represented with equal frequency. This representation allowed Sturtevant to additively calculate distances between several genes on the same chromosome. However, as the genetic distances approached 0.50, his predictions became less accurate because it was not clear whether the genes were very far apart on the same or on different chromosomes.
In 1931, Barbara McClintock and Harriet Creighton demonstrated the crossover of homologous chromosomes in corn plants. Weeks later, Curt Stern demonstrated microscopically homologous recombination in Drosophila. Stern observed several X-linked phenotypes that were associated with a structurally unusual and dissimilar X chromosome pair in which one X was missing a small terminal segment, and the other X was fused to a piece of the Y chromosome. By crossing flies, observing their offspring, and then visualizing the offspring’s chromosomes, Stern demonstrated that every time the offspring allele combination deviated from either of the parental combinations, there was a corresponding exchange of an X chromosome segment. Using mutant flies with structurally distinct X chromosomes was the key to observing the products of recombination because DNA sequencing and other molecular tools were not yet available. We now know that homologous chromosomes regularly exchange segments in meiosis by reciprocally breaking and rejoining their DNA at precise locations. Aurora Ruiz-Herrera, for example, studies the occurrence of genetic breakpoints at locations in the chromosomes known as fragile sites. By identifying chromosomal fragile sites that are shared between humans and other primates, Ruiz-Herrera has provided a deeper understanding of mammalian and specifically human evolution.
Mendel’s Mapped Traits
Homologous recombination is a common genetic process, yet Mendel never observed it. Had he investigated both linked and unlinked genes, it would have been much more difficult for him to create a unified model of his data on the basis of probabilistic calculations. Researchers who have since mapped the seven traits that Mendel investigated onto a pea plant genome’s seven chromosomes have confirmed that all the genes he examined are either on separate chromosomes or are sufficiently far apart as to be statistically unlinked. Some have suggested that Mendel was enormously lucky to select only unlinked genes; whereas, others question whether Mendel discarded any data suggesting linkage. In any case, Mendel consistently observed independent assortment because he examined genes that were effectively unlinked.
Summary
Sutton and Boveri’s Chromosomal Theory of Inheritance states that chromosomes are the vehicles of genetic heredity. Neither Mendelian genetics nor gene linkage is perfectly accurate. Instead, chromosome behavior involves segregation, independent assortment, and occasionally, linkage. Sturtevant devised a method to assess recombination frequency and infer linked genes’ relative positions and distances on a chromosome on the basis of the average number of crossovers in the intervening region between the genes. Sturtevant correctly presumed that genes are arranged in serial order on chromosomes and that recombination between homologs can occur anywhere on a chromosome with equal likelihood. Whereas linkage causes alleles on the same chromosome to be inherited together, homologous recombination biases alleles toward an independent inheritance pattern.
Key terms
- centimorgan (cM) — (also, map unit) relative distance that corresponds to a 0.01 recombination frequency
- Chromosomal Theory of Inheritance — theory proposing that chromosomes are the genes’ vehicles and that their behavior during meiosis is the physical basis of the inheritance patterns that Mendel observed
- homologous recombination — process by which homologous chromosomes undergo reciprocal physical exchanges at their arms, also crossing over
- nonparental (recombinant) type — progeny resulting from homologous recombination that exhibits a different allele combination compared with its parents
- parental types — progeny that exhibits the same allelic combination as its parents
- recombination frequency — average number of crossovers between two alleles; observed as the number of nonparental types in a progeny’s population
Practice
Discuss Sutton’s Chromosomal Theory of Inheritance
Explain how the Chromosomal Theory of Inheritance helped to advance our understanding of genetics.
Show model answer
Did your answer mention:
The theory proposing that chromosomes are the vehicles of genes, and that their behavior during meiosis is the physical basis of the inheritance patterns Mendel observed, is called the ________.
Sutton and Boveri each proposed it independently in 1902.Sutton and Boveri’s Chromosomal Theory of Inheritance states that chromosomes are the vehicles of ________.
The section summary’s opening sentence names what chromosomes serve as, according to the theory.Describe genetic linkage
X-linked recessive traits in humans (or in Drosophila) are observed ________.
Males are hemizygous for the X chromosome, so a single copy of a recessive X-linked allele is enough for the trait to appear.Which recombination frequency corresponds to perfect linkage and violates the law of independent assortment?
Perfect linkage means the alleles on a chromosome are always inherited together, so no recombinant offspring appear.According to the section summary, chromosome behavior involves segregation, independent assortment, and occasionally, ________.
This is the phenomenon that departs from Mendel’s predicted ratios when genes share a chromosome.Explain the process of homologous recombination, or crossing over
The first suggestion that chromosomes may physically exchange segments came from the microscopic identification of ________.
Frans Janssens observed these points of contact between chromatids before the first meiotic division, in 1909.Reciprocal physical exchange of chromosome segments between paired chromosomes during meiosis is a process scientists call ________.
Frans Janssens’s 1909 observations of chiasmata were the first evidence of it; Sturtevant used its frequency between genes to build the first chromosome map.Whereas linkage causes alleles on the same chromosome to be inherited together, ________ biases alleles toward an independent inheritance pattern, according to the section summary.
It is the process this section also calls “crossing over.”Describe chromosome creation
The map-distance unit Sturtevant used for his first chromosome map, in which a 0.01 recombination frequency corresponds to a distance of 1, is abbreviated with two letters.
It is spelled out in the Key terms list above.Who created the first chromosome map by mathematically analyzing his laboratory’s recombination data over the course of one night?
He was an undergraduate student in Morgan’s laboratory in 1913.According to the section summary, Sturtevant devised a method to assess recombination frequency and infer linked genes’ relative ________ on a chromosome.
This is exactly what building the first chromosome map required inferring from the recombination data.Calculate the distances between three genes on a chromosome using a three-point test cross
Which recombination frequency corresponds to independent assortment and the absence of linkage?
At this frequency, every allele combination — parental and nonparental alike — appears equally often, exactly as it would for unlinked genes.According to the genetic map described in the text, the gene for body color sits at 48.5 cM and the gene for wing length sits at 65.5 cM. What is the map distance between these two genes?
Subtract the smaller map position from the larger one, exactly as the text does for these two genes.According to the section summary, Sturtevant correctly presumed that genes are arranged in ________ on chromosomes.
This is one of the two assumptions underlying his method of calculating map distances additively.This section is adapted from Biology 2e, Section 13.1: Chromosomal Theory and Genetic Linkage by Mary Ann Clark, Jung Choi, Matthew Douglas, and OpenStax, © OpenStax, licensed under CC BY-NC-SA 4.0. Access the original for free at openstax.org. Changes: figures re-encoded as WebP; Figure_13_01_02 re-kinded from the manifest’s file-extension guess of “photo” to “diagram” after inspection (it is a colored illustrated diagram, not a photograph), its source alt (a letter-spaced, allele-by-allele description) rewritten from the image with the full panel-by-panel walkthrough moved into a longdesc; a longdesc also added for the Figure_13_01_03 chromosome map, since its full table of gene positions is not carried by the one-line caption; allele wild-type superscripts set as the Unicode plus (b⁺, vg⁺) rather than the source’s italicized <sup>+</sup> markup, for a single consistent glyph; the Key terms entry for “centimorgan (cM)” corrected from a printed “a 0,01 recombination frequency” to “a 0.01 recombination frequency” — the source’s own comma-for-decimal-point typo, present in both the pinned CNXML and the printed PDF Key Terms list, and contradicted by this same section’s own later sentence using a period (“a 0.01 recombination frequency corresponds to 1 cM”) — reported as a source defect; both Visual Connection notes kept in the body immediately after their figures: the recombinant-frequency question (keyed with a prose solution) rendered as a self-check, and the “which statement is true” genetic-map question rendered as multiple choice, since the source keys it to a lettered option; the interactive note rendered as a Link to Learning callout with descriptive anchor text in place of the source’s bare “here”; the end-of-section Review Questions and Critical Thinking Question adapted into the closing interactive Practice block; two key-term recall items (Chromosomal Theory of Inheritance, homologous recombination/crossing over) added from the glossary; and, because no source exercise or glossary term in this section tests “Describe chromosome creation” or “Calculate the distances between three genes on a chromosome using a three-point test cross” as printed, three Practice items for those two objectives are author-written strictly from the section’s own paragraphs about Sturtevant’s overnight construction of the first chromosome map and its worked 65.5 − 48.5 = 17 cM distance calculation between two mapped genes — the section computes pairwise map distance from recombination frequency but does not present a three-point test cross; the surname of the cytologist who observed chiasmata corrected from the source’s “Frans Janssen” to “Frans Janssens” in prose and hints (reported as a source defect); rubric checkpoints added to each self-check, decomposing its model answer (the source solution) into check-off clauses with no new claims; and five summary-derived items added, one per objective group to raise each to three (the theory’s genes-as-heredity-vehicles clause, the summary’s “occasionally, linkage” clause, the summary’s linkage-versus-recombination contrast clause, the summary’s “relative positions and distances” clause, and the summary’s “serial order” assumption clause), each a cloze textin or select-the-term multiple choice built strictly from the section’s own Section Summary sentences. One date is corrected with a visible Source note: Mendel’s heredity research begins in 1856, as this book’s own Mendel chapter says, not 1843 (erratum 398).