Mapping Genomes
By the end of this section, you will be able to:
- Define genomics
- Describe genetic and physical maps
- Describe genomic mapping methods
Genomics is the study of entire genomes, including the complete set of genes, their nucleotide sequence and organization, and their interactions within a species and with other species. Genome mapping is the process of finding the locations of genes on each chromosome. The maps that genome mapping create are comparable to the maps that we use to navigate streets. A genetic map is an illustration that lists genes and their location on a chromosome. Genetic maps provide the big picture (similar to an interstate highway map) and use genetic markers (similar to landmarks). A genetic marker is a gene or sequence on a chromosome that co-segregates (shows genetic linkage) with a specific trait. Early geneticists called this linkage analysis. Physical maps present the intimate details of smaller chromosome regions (similar to a detailed road map). A physical map is a representation of the physical distance, in nucleotides, between genes or genetic markers. Both genetic linkage maps and physical maps are required to build a genome’s complete picture. Having a complete genome map of the genome makes it easier for researchers to study individual genes. Human genome maps help researchers in their efforts to identify human disease-causing genes related to illnesses like cancer, heart disease, and cystic fibrosis. We can use genome mapping in a variety of other applications, such as using live microbes to clean up pollutants or even prevent pollution. Research involving plant genome mapping may lead to producing higher crop yields or developing plants that better adapt to climate change.
Genetic Maps
The study of genetic maps begins with linkage analysis, a procedure that analyzes the recombination frequency between genes to determine if they are linked or show independent assortment. Scientists used the term linkage before the discovery of DNA. Early geneticists relied on observing phenotypic changes to understand an organism’s genotype. Shortly after Gregor Mendel (the father of modern genetics) proposed that traits were determined by what we now call genes, other researchers observed that different traits were often inherited together, and thereby deduced that the genes were physically linked by their location on the same chromosome. Gene mapping relative to each other based on linkage analysis led to developing the first genetic maps.
Observations that certain traits were always linked and certain others were not linked came from studying the offspring of crosses between parents with different traits. For example, in garden pea experiments, researchers discovered, that the flower’s color and plant pollen’s shape were linked traits, and therefore the genes encoding these traits were in close proximity on the same chromosome. We call exchanging DNA between homologous chromosome pairs genetic recombination, which occurs by crossing over DNA between homologous DNA strands, such as nonsister chromatids. Linkage analysis involves studying the recombination frequency between any two genes. The greater the distance between two genes, the higher the chance that a recombination event will occur between them, and the higher the recombination frequency between them. The figure below shows two possibilities for recombination between two nonsister chromatids during meiosis. If the recombination frequency between two genes is less than 50 percent, they are linked.
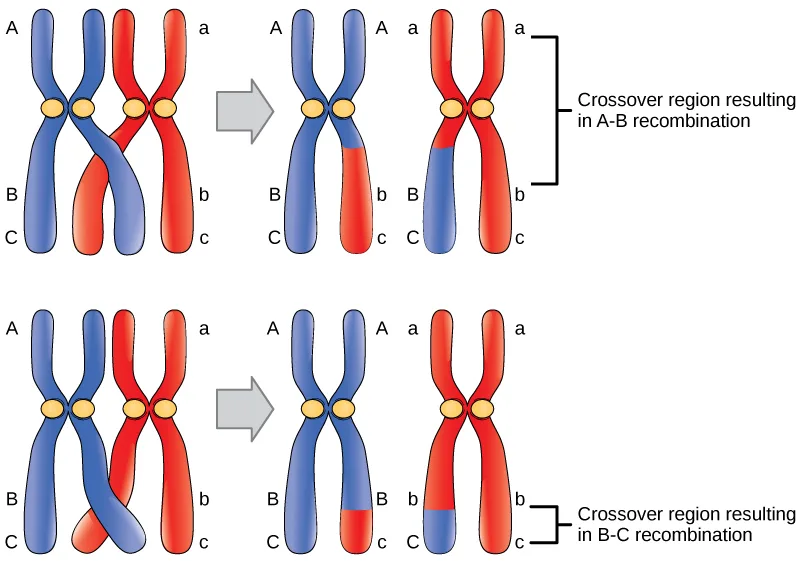
Extended description
Two rows, each showing a homologous chromosome pair — drawn as two joined X-shaped sister-chromatid sets, one arm colored blue and labeled A at the top with B and C down its lower arm, the other colored red and labeled a at the top with b and c down its lower arm, meeting at yellow centromeres — before and after a crossover, connected by a gray arrow. In each row, one chromatid from the blue chromosome and one from the red chromosome cross and swap color at a single point; the other two chromatids stay unchanged. Top row: the crossover point sits just below the centromere, between the A/a level and the B/b level, so the swapped chromatids carry A above the crossover and b, c below it (or a above and B, C below); a bracket beside the two recombinant chromosomes reads ‘Crossover region resulting in A-B recombination,’ spanning the larger swapped segment. Bottom row: the crossover point sits farther down, between the B/b level and the C/c level, so the swapped chromatids keep their original A, B (or a, b) and exchange only C (or c) at the very tip; the bracket there reads ‘Crossover region resulting in B-C recombination,’ spanning the much narrower swapped segment.
The generation of genetic maps requires markers, just as a road map requires landmarks (such as rivers and mountains). Scientists based early genetic maps on using known genes as markers. Scientists now use more sophisticated markers, including those based on non-coding DNA, to compare individuals’ genomes in a population. Although individuals of a given species are genetically similar, they are not identical. Every individual has a unique set of traits. These minor differences in the genome between individuals in a population are useful for genetic mapping purposes. In general, a good genetic marker is a region on the chromosome that shows variability or polymorphism (multiple forms) in the population.
Some genetic markers that scientists use in generating genetic maps are restriction fragment length polymorphisms (RFLP), variable number of tandem repeats (VNTRs), microsatellite polymorphisms, and the single nucleotide polymorphisms (SNPs). We can detect RFLPs (sometimes pronounced “rif-lips”) when the DNA of an individual is cut with a restriction endonuclease that recognizes specific sequences in the DNA to generate a series of DNA fragments, which we can then analyze using gel electrophoresis. Every individual’s DNA will give rise to a unique pattern of bands when cut with a particular set of restriction endonucleases. Scientists sometimes refer to this as an individual’s DNA “fingerprint.” Certain chromosome regions that are subject to polymorphism will lead to generating the unique banding pattern. VNTRs are repeated sets of nucleotides present in DNA’s non-coding regions. Non-coding, or “junk,” DNA has no known biological function; however, research shows that much of this DNA is actually transcribed. While its function is uncertain, it is certainly active, and it may be involved in regulating coding genes. The number of repeats may vary in a population’s individual organisms. Microsatellite polymorphisms are similar to VNTRs, but the repeat unit is very small. SNPs are variations in a single nucleotide.
Because genetic maps rely completely on the natural process of recombination, natural increases or decreases in the recombination level of a given genome area affects mapping. Some parts of the genome are recombination hotspots; whereas, others do not show a propensity for recombination. For this reason, it is important to look at mapping information developed by multiple methods.
Physical Maps
A physical map provides detail of the actual physical distance between genetic markers, as well as the number of nucleotides. There are three methods scientists use to create a physical map: cytogenetic mapping, radiation hybrid mapping, and sequence mapping. Cytogenetic mapping uses information from microscopic analysis of stained chromosome sections (see the figure below). It is possible to determine the approximate distance between genetic markers using cytogenetic mapping, but not the exact distance (number of base pairs). Radiation hybrid mapping uses radiation, such as x-rays, to break the DNA into fragments. We can adjust the radiation amount to create smaller or larger fragments. This technique overcomes the limitation of genetic mapping, and we can adjust the radiation so that increased or decreased recombination frequency does not affect it. Sequence mapping resulted from DNA sequencing technology that allowed for creating detailed physical maps with distances measured in terms of the number of base pairs. Creating genomic libraries and complementary DNA (cDNA) libraries (collections of cloned sequences or all DNA from a genome) has sped the physical mapping process. A genetic site that scientists use to generate a physical map with sequencing technology (a sequence-tagged site, or STS) is a unique sequence in the genome with a known exact chromosomal location. An expressed sequence tag (EST) and a single sequence length polymorphism (SSLP) are common STSs. An EST is a short STS that we can identify with cDNA libraries, while we obtain SSLPs from known genetic markers, which provide a link between genetic and physical maps.
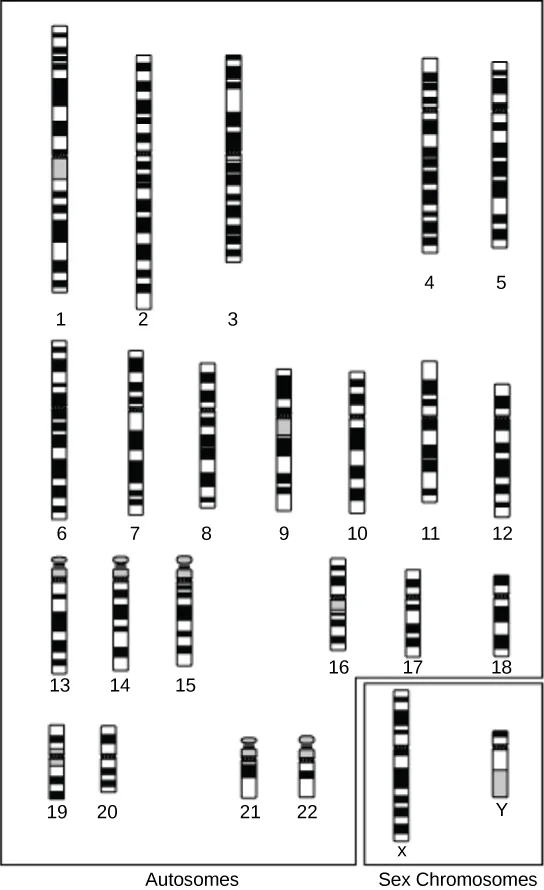
Extended description
Twenty-four chromosome ideograms are arranged in a grid: a large box holds the 22 autosomes in four rows — row 1: chromosomes 1 through 5 (1 through 3 grouped together, then 4 and 5 set apart to the right); row 2: chromosomes 6 through 12, all similar in length; row 3: chromosomes 13 through 15, each with a small stalked short arm, followed by 16 through 18, progressively shorter; row 4: chromosomes 19 through 22, the shortest of the autosomes, with 21 and 22 carrying the same small stalked short arm as 13 through 15. A separate box at the bottom right holds the sex chromosomes, X and Y, with X close in length to the mid-size autosomes and Y the shortest bar in the whole figure. Every bar carries its own sequence of black, white, and gray horizontal bands, and the chromosome number is printed below each bar.
Genetic and Physical Maps Integration
Genetic maps provide the outline and physical maps provide the details. It is easy to understand why both genome mapping technique types are important to show the big picture. Scientists use information from each technique in combination to study the genome. Scientists are using genomic mapping with different model organisms for research. Genome mapping is still an ongoing process, and as researchers develop more advanced techniques, they expect more breakthroughs. Genome mapping is similar to completing a complicated puzzle using every piece of available data. Mapping information generated in laboratories all over the world goes into central databases, such as GenBank at the National Center for Biotechnology Information (NCBI). Researchers are making efforts for the information to be more easily accessible to other researchers and the general public. Just as we use global positioning systems instead of paper maps to navigate through roadways, NCBI has created a genome viewer tool to simplify the data-mining process.
Scientific Method Connection. How to Use a Genome Map Viewer
Problem statement: Do the human, macaque, and mouse genomes contain common DNA sequences?
Develop a hypothesis.
Go to a web page comparing many organisms’ gene sequences to the human insulin receptor gene to test the hypothesis.
The web page displays the comparison of the gene sequences of many organisms to the Human Insulin Receptor gene. Explore the type of information provided, select the groups of organisms needed for testing of the hypothesis from the top portion of the displayed data. Focus the attention to the bottom part, the Selected Orthologues. Explore which columns are relevant to the needed information.
On the same page, there are other options to explore, not all are necessary for the task, however it might give more insight to the value of genome/gene comparisons.
Summary
Genome mapping is similar to solving a big, complicated puzzle with pieces of information coming from laboratories all over the world. Genetic maps provide an outline for locating genes within a genome, and they estimate the distance between genes and genetic markers on the basis of recombination frequencies during meiosis. Physical maps provide detailed information about the physical distance between the genes. The most detailed information is available through sequence mapping. Researchers combine information from all mapping and sequencing sources to study an entire genome.
Key terms
- cytogenetic mapping — technique that uses a microscope to create a map from stained chromosomes
- expressed sequence tag (EST) — short STS that is identified with cDNA
- genetic map — outline of genes and their location on a chromosome
- genetic marker — gene or sequence on a chromosome with a known location that is associated with a specific trait
- genetic recombination — DNA exchange between homologous chromosome pairs
- genome mapping — process of finding the location of genes on each chromosome
- cDNA library — collection of cloned cDNA sequences
- genomic library — collection of cloned DNA which represents all of the sequences and fragments from a genome
- genomics — study of entire genomes including the complete set of genes, their nucleotide sequence and organization, and their interactions within a species and with other species
- linkage analysis — procedure that analyzes recombining genes to determine if they are linked
- microsatellite polymorphism — variation between individuals in the sequence and number of microsatellite DNA repeats
- physical map — representation of the physical distance between genes or genetic markers
- radiation hybrid mapping — information obtained by fragmenting the chromosome with x-rays
- restriction fragment length polymorphism (RFLP) — variation between individuals in the length of DNA fragments, which restriction endonucleases generate
- sequence mapping — mapping information obtained after DNA sequencing
- single nucleotide polymorphism (SNP) — variation between individuals in a single nucleotide
- variable number of tandem repeats (VNTRs) — variation in the number of tandem repeats between individuals in the population
Practice
Define genomics
Why is so much effort being poured into genome mapping applications?
Show model answer
Did your answer mention:
The study of entire genomes, including the complete set of genes, their nucleotide sequence and organization, and their interactions within a species and with other species, is called ________.
This is the very first term the section defines, in its opening sentence.The process of finding the location of genes on each chromosome is called ________.
It’s the process the whole section describes — genetic maps and physical maps are two of its products.Describe genetic and physical maps
Genetic recombination occurs by which process?
The sentence that defines genetic recombination names the exchange process directly.Individual genetic maps in a given species are:
The section says individuals of a species share genetic similarity without being identical — that’s exactly what makes their minor differences useful as markers.How could a genetic map of the human genome help find a cure for cancer?
Show model answer
Did your answer mention:
A representation of the actual distance, measured in nucleotides, between genes or genetic markers is called a ________.
It is the section’s second boxed definition, right after genetic map — its scale is nucleotides, not chromosome position.Describe genomic mapping methods
ESTs are ________.
Check the definition against each option — an EST is a short STS identified with a cDNA library, so more than one option holds true.Linkage analysis ________.
Linkage analysis opens the Genetic Maps section — it studies a process that happens naturally during meiosis, not one that radiation or lab tools create.Information obtained by microscopic analysis of stained chromosomes is used in:
The Physical Maps section names the one mapping method that works directly from a microscope and stained chromosomes.Variation between individuals in the length of DNA fragments produced by restriction endonucleases is known by the abbreviation ________.
The section gives its phonetic nickname, “rif-lips,” right after naming the abbreviation.This section is adapted from Biology 2e, Section 17.2: Mapping Genomes by Mary Ann Clark, Jung Choi, Matthew Douglas, and OpenStax, © OpenStax, licensed under CC BY-NC-SA 4.0. Access the original for free at openstax.org. Changes: figures re-encoded as WebP; both figures re-kinded from the manifest’s file-extension guess of “photo” to “diagram” (a colored crossover schematic and a chromosome-ideogram chart, neither a photograph); Figure_17_02_01’s alt rewritten from the image — the source alt ran to 680 characters, over the 600-character accessibility limit, so a shorter alt was written and the panel-by-panel walkthrough moved into a longdesc; a longdesc also added for Figure_17_02_02, walking its four rows of autosomes and the boxed sex chromosomes; the two source cross-references to these figures (“Figure 17.11,” “Figure 17.12”) rewritten as “the figure below,” since figures are not numbered here; both feature boxes rendered as callouts with their bold names — the “scientific” note as Scientific Method Connection, kept with its title, problem statement, and hypothesis prompt, and the “interactive” note as Link to Learning — with the source’s generic anchor text (“this website,” “Click this link”) replaced by link text describing each destination from the box’s own following sentence; the end-of-section Review Questions and Critical Thinking Questions adapted into the closing interactive Practice block; four key-term recall items added from the glossary (genomics and genome mapping under “Define genomics,” physical map under “Describe genetic and physical maps,” and RFLP under “Describe genomic mapping methods”) to give every objective group an item beyond the source exercise sets; and rubric checkpoints added to each self-check, decomposing its model answer (the source solution) into check-off clauses with no new claims.