Population Evolution
By the end of this section, you will be able to:
- Define population genetics and describe how scientists use population genetics in studying population evolution
- Define the Hardy-Weinberg principle and discuss its importance
People did not understand the mechanisms of inheritance, or genetics, at the time Charles Darwin and Alfred Russel Wallace were developing their idea of natural selection. This lack of knowledge was a stumbling block to understanding many aspects of evolution. The predominant (and incorrect) genetic theory of the time, blending inheritance, made it difficult to understand how natural selection might operate. Darwin and Wallace were unaware of the Austrian monk Gregor Mendel’s 1866 publication “Experiments in Plant Hybridization”, which came out not long after Darwin’s book, On the Origin of Species. Scholars rediscovered Mendel’s work in the early twentieth century at which time geneticists were rapidly coming to an understanding of the basics of inheritance. Initially, the newly discovered particulate nature of genes made it difficult for biologists to understand how gradual evolution could occur. However, over the next few decades scientists integrated genetics and evolution in what became known as the modern synthesis—the coherent understanding of the relationship between natural selection and genetics that took shape by the 1940s. Generally, this concept is accepted today. In short, the modern synthesis describes how evolutionary processes, such as natural selection, can affect a population’s genetic makeup, and, in turn, how this can result in the gradual evolution of populations and species. The theory also connects population change over time (microevolution), with the processes that gave rise to new species and higher taxonomic groups with widely divergent characters (macroevolution).
Everyday Connection. Evolution and Flu Vaccines.
Every fall, the media starts reporting on flu vaccinations and potential outbreaks. Scientists, health experts, and institutions determine recommendations for different parts of the population, predict optimal production and inoculation schedules, create vaccines, and set up clinics to provide inoculations. You may think of the annual flu shot as media hype, an important health protection, or just a briefly uncomfortable prick in your arm. However, do you think of it in terms of evolution?
The media hype of annual flu shots is scientifically grounded in our understanding of evolution. Each year, scientists across the globe strive to predict the flu strains that they anticipate as most widespread and harmful in the coming year. They base this knowledge on how flu strains have evolved over time and over the past few flu seasons. Scientists then work to create the most effective vaccine to combat those selected strains. Pharmaceutical companies produce hundreds of millions of doses in a short period in order to provide vaccinations to key populations at the optimal time.
Because viruses, like the flu, evolve very quickly (especially in evolutionary time), this poses quite a challenge. Viruses mutate and replicate at a fast rate, so the vaccine developed to protect against last year’s flu strain may not provide the protection one needs against the coming year’s strain. Evolution of these viruses means continued adaptations to ensure survival, including adaptations to survive previous vaccines.
Population Genetics
Recall that a gene for a particular character may have several alleles, or variants, that code for different traits associated with that character. For example, in the ABO blood type system in humans, three alleles determine the particular blood-type carbohydrate on the surface of red blood cells. Each individual in a population of diploid organisms can only carry two alleles for a particular gene, but more than two may be present in the individuals that comprise the population. Mendel followed alleles as they were inherited from parent to offspring. In the early twentieth century, biologists in the area of population genetics began to study how selective forces change a population through changes in allele and genotypic frequencies.
The allele frequency (or gene frequency) is the rate at which a specific allele appears within a population. Until now we have discussed evolution as a change in the characteristics of a population of organisms, but behind that phenotypic change is genetic change. In population genetics, scientists define the term evolution as a change in the allele’s frequency in a population. Using the ABO blood type system as an example, the frequency of one of the alleles, IA, is the number of copies of that allele divided by all the copies of the ABO gene in the population. For example, a study in Jordan (Sahar S. Hanania, Dhia S. Hassawi, and Nidal M. Irshaid, “Allele Frequency and Molecular Genotypes of ABO Blood Group System in a Jordanian Population,” Journal of Medical Sciences 7 (2007): 51-58, doi:10.3923/jms.2007.51.58) found a frequency of IA to be 26.1 percent. The IB and I0 alleles comprise 13.4 percent and 60.5 percent of the alleles respectively, and all of the frequencies added up to 100 percent. A change in this frequency over time would constitute evolution in the population.
The allele frequency within a given population can change depending on environmental factors; therefore, certain alleles become more widespread than others during the natural selection process. Natural selection can alter the population’s genetic makeup. An example is if a given allele confers a phenotype that allows an individual to better survive or have more offspring. Because many of those offspring will also carry the beneficial allele, and often the corresponding phenotype, they will have more offspring of their own that also carry the allele, thus, perpetuating the cycle. Over time, the allele will spread throughout the population. Some alleles will quickly become fixed in this way, meaning that every individual of the population will carry the allele, while detrimental mutations may be swiftly eliminated if derived from a dominant allele from the gene pool. The gene pool is the sum of all the alleles in a population.
Sometimes, allele frequencies within a population change randomly with no advantage to the population over existing allele frequencies. We call this phenomenon genetic drift. Natural selection and genetic drift usually occur simultaneously in populations and are not isolated events. It is hard to determine which process dominates because it is often nearly impossible to determine the cause of change in allele frequencies at each occurrence. We call an event that initiates an allele frequency change in an isolated part of the population, which is not typical of the original population, the founder effect. Natural selection, random drift, and founder effects can lead to significant changes in a population’s genome.
Hardy-Weinberg Principle of Equilibrium
In the early twentieth century, English mathematician Godfrey Hardy and German physician Wilhelm Weinberg stated the principle of equilibrium to describe the population’s genetic makeup. The theory, which later became known as the Hardy-Weinberg principle of equilibrium, states that a population’s allele and genotype frequencies are inherently stable—unless some kind of evolutionary force is acting upon the population, neither the allele nor the genotypic frequencies would change. The Hardy-Weinberg principle assumes an infinitely large population and conditions with no mutations, migration, emigration, or selective pressure for or against genotype. While no population can satisfy those conditions, the principle offers a useful model against which to compare real population changes.
Working under this theory, population geneticists represent different alleles as different variables in their mathematical models. The variable p, for example, often represents the frequency of a particular allele, say Y for the trait of yellow in Mendel’s peas, while the variable q represents the frequency of y alleles that confer the color green. If these are the only two possible alleles for a given locus in the population, p + q = 1. In other words, all the p alleles and all the q alleles comprise all of the alleles for that locus in the population.
However, what ultimately interests most biologists is not the frequencies of different alleles, but the frequencies of the resulting genotypes, known as the population’s genetic structure, from which scientists can surmise phenotype distribution. If we observe the phenotype, we can know only the homozygous recessive allele’s genotype. The calculations provide an estimate of the remaining genotypes. Since each individual carries two alleles per gene, if we know the allele frequencies (p and q), predicting the genotypes’ frequencies is a simple mathematical calculation to determine the probability of obtaining these genotypes if we draw two alleles at random from the gene pool. In the above scenario, an individual pea plant could be pp (YY), and thus produce yellow peas; pq (Yy), also yellow; or qq (yy), and thus produce green peas (see the figure below). In other words, the frequency of pp individuals is simply p2; the frequency of pq individuals is 2pq; and the frequency of qq individuals is q2. Again, if p and q are the only two possible alleles for a given trait in the population, these genotypes frequencies will sum to one: p2 + 2pq + q2 = 1.
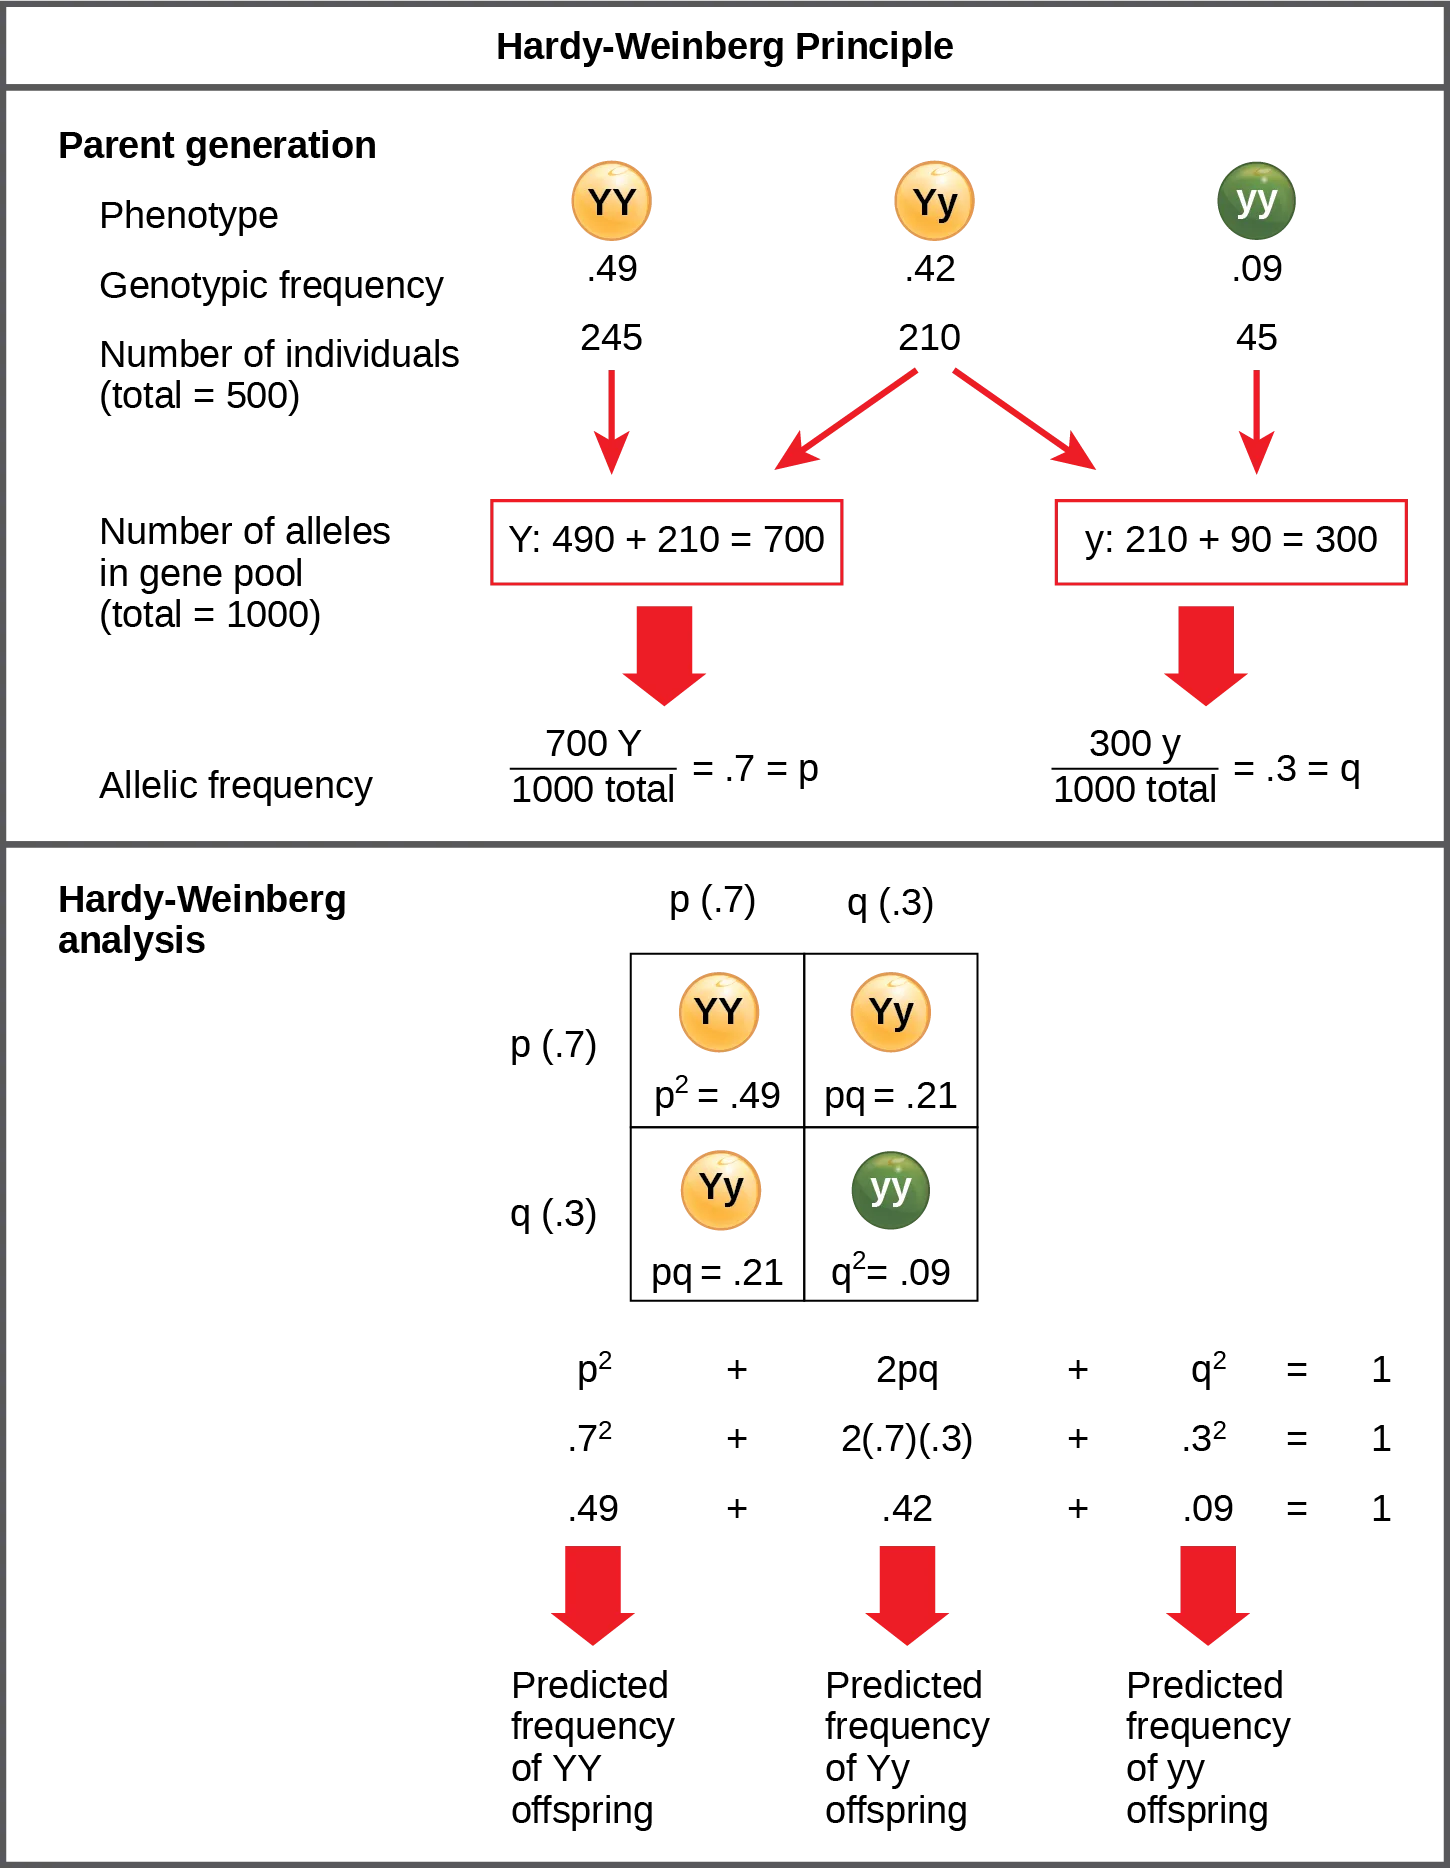
Extended description
Top panel, ‘Parent generation’: three genotype circles are each labeled with their phenotype, genotypic frequency, and count out of 500 individuals — a gold circle ‘YY’ at .49 frequency (245 individuals), a gold circle ‘Yy’ at .42 frequency (210 individuals), and a green circle ‘yy’ at .09 frequency (45 individuals). Red arrows carry each count down into two boxed allele totals: the YY count plus half the Yy count sum to ‘Y: 490 + 210 = 700,’ and the yy count plus the other half of the Yy count sum to ‘y: 210 + 90 = 300.’ Below each box, a red arrow points to the allele frequency: 700 Y over 1000 total = .7 = p, and 300 y over 1000 total = .3 = q. Bottom panel, ‘Hardy-Weinberg analysis’: a 2×2 grid crosses p (.7) and q (.3) on each axis, producing four cells, each showing its matching genotype circle — top-left ‘YY, p² = .49,’ top-right ‘Yy, pq = .21,’ bottom-left ‘Yy, pq = .21,’ bottom-right ‘yy, q² = .09.’ Below the grid, three lines of the same equation are stacked: p² + 2pq + q² = 1, then .7² + 2(.7)(.3) + .3² = 1, then .49 + .42 + .09 = 1. Three red arrows point from these sums down to labels reading ‘Predicted frequency of YY offspring,’ ‘Predicted frequency of Yy offspring,’ and ‘Predicted frequency of yy offspring.’
In plants, violet flower color (V) is dominant over white (v). If p = 0.8 and q = 0.2 in a population of 500 plants, how many individuals would you expect to be homozygous dominant (VV), heterozygous (Vv), and homozygous recessive (vv)? How many plants would you expect to have violet flowers, and how many would have white flowers?
Show model answer
Did your answer mention:
In theory, if a population is at equilibrium—that is, there are no evolutionary forces acting upon it—generation after generation would have the same gene pool and genetic structure, and these equations would all hold true all of the time. Of course, even Hardy and Weinberg recognized that no natural population is immune to evolution. Populations in nature are constantly changing in genetic makeup due to drift, mutation, possibly migration, and selection. As a result, the only way to determine the exact distribution of phenotypes in a population is to go out and count them. However, the Hardy-Weinberg principle gives scientists a mathematical baseline of a non-evolving population to which they can compare evolving populations and thereby infer what evolutionary forces might be at play. If the frequencies of alleles or genotypes deviate from the value expected from the Hardy-Weinberg equation, then the population is evolving.
Summary
The modern synthesis of evolutionary theory grew out of the cohesion of Darwin’s, Wallace’s, and Mendel’s thoughts on evolution and heredity, along with the more modern study of population genetics. It describes the evolution of populations and species, from small-scale changes among individuals to large-scale changes over paleontological time periods. To understand how organisms evolve, scientists can track populations’ allele frequencies over time. If they differ from generation to generation, scientists can conclude that the population is not in Hardy-Weinberg equilibrium, and is thus evolving.
Key terms
- allele frequency — (also, gene frequency) rate at which a specific allele appears within a population
- founder effect — event that initiates an allele frequency change in part of the population, which is not typical of the original population
- gene pool — all the alleles that the individuals in the population carry
- genetic structure — distribution of the different possible genotypes in a population
- macroevolution — broader scale evolutionary changes that scientists see over paleontological time
- microevolution — changes in a population’s genetic structure
- modern synthesis — overarching evolutionary paradigm that took shape by the 1940s and scientists generally accept today
- population genetics — study of how selective forces change the allele frequencies in a population over time
Practice
Define population genetics and describe how scientists use population genetics in studying population evolution
What is the difference between micro- and macroevolution?
The opening paragraph names microevolution as population change over time and macroevolution as the processes that gave rise to new species and higher taxonomic groups.Population genetics is the study of:
The ‘Population Genetics’ section’s opening paragraphs say what the field studies, and the glossary defines the term the same way.One of the original Amish colonies rose from a ship of colonists that came from Europe. The ship’s captain, who had polydactyly, a rare dominant trait, was one of the original colonists. Today, we see a much higher frequency of polydactyly in the Amish population. This is an example of:
A rare trait becoming common because one early colonist of a small, isolated founding population happened to carry it — not because the trait was favored — is this section’s founder effect, a random change in allele frequencies rather than selection.The rate at which a specific allele appears within a population is called its ________.
Population geneticists track how this rate shifts from one generation to the next; the Key terms list gives it a second, gene-based name.Define the Hardy-Weinberg principle and discuss its importance
Which of the following populations is not in Hardy-Weinberg equilibrium?
Hardy-Weinberg equilibrium assumes no evolutionary force is acting on the population; natural selection is one such force.Solve for the genetic structure of a population with 12 homozygous recessive individuals (yy), 8 homozygous dominant individuals (YY), and 4 heterozygous individuals (Yy).
Show model answer
Did your answer mention:
Explain the Hardy-Weinberg principle of equilibrium theory.
Show model answer
Did your answer mention:
Imagine you are trying to test whether a population of flowers is undergoing evolution. You suspect there is selection pressure on the color of the flower: bees seem to cluster around the red flowers more often than the blue flowers. In a separate experiment, you discover blue flower color is dominant to red flower color. In a field, you count 600 blue flowers and 200 red flowers. What would you expect the genetic structure of the flowers to be?
Show model answer
Did your answer mention:
The distribution of the different possible genotypes in a population is called its ________.
From this, scientists can surmise how the population’s phenotypes are distributed.This section is adapted from Biology 2e, Section 19.1: Population Evolution by Mary Ann Clark, Jung Choi, Matthew Douglas, and OpenStax, © OpenStax, licensed under CC BY-NC-SA 4.0. Access the original for free at openstax.org. Changes: the figure re-encoded as WebP; Figure_B19_01_02’s source alt (an over-600-character, value-by-value walkthrough of the diagram) rewritten from the image into a concise alt naming what the two panels show, with the full step-by-step reading — every labeled circle, box, arrow, and stacked equation line — moved into a longdesc; the footnoted Jordan ABO study citation kept as a parenthetical after the sentence it supports rather than dropped; both feature boxes rendered as callouts with their bold names (Everyday Connection, Link to Learning), the interactive note’s URL kept; the Visual Connection note kept in the body immediately after its figure and rendered as a self-check, since the source keys it with a prose solution rather than a lettered option; the source solution’s “160Vv” corrected to “160 Vv” to match the same sentence’s own “320 VV” and “20 vv” spacing (reported as a source defect); the Critical Thinking flower-population solution’s unmarked “q2”/“p2” exponents set as HTML superscript (q2, p2) to match the module’s own convention used in the sibling genetic-structure solution and in the body’s own Hardy-Weinberg equation (reported as a source defect); the genetic-structure solution’s “2pq = .48” corrected to “2pq = .49”, the value its own rounding convention gives (p² .17 + 2pq .49 + q² .34 sum to exactly 1.00; reported as a source defect); the equilibrium Review Question’s first option — the source’s 12 yy / 8 YY / 4 Yy census, which is itself out of Hardy-Weinberg proportions by the module’s own arithmetic, leaving two options correct — replaced with a 6 YY / 12 Yy / 6 yy census that sits exactly at Hardy-Weinberg proportions (reported as a source defect); the end-of-section Review Questions and Critical Thinking Questions adapted into the closing interactive Practice block (multiple choice and self-check respectively); rubric checkpoints added to every self-check (including the body’s Visual Connection self-check), decomposing its model answer — the source solution — into check-off clauses with no new claims; and two key-term recall items (allele frequency, genetic structure) added from the glossary to give each objective group an auto-graded item.