Vision
By the end of this section, you will be able to:
- Explain how electromagnetic waves differ from sound waves
- Trace the path of light through the eye to the point of the optic nerve
- Explain tonic activity as it is manifested in photoreceptors in the retina
Vision is the ability to detect light patterns from the outside environment and interpret them into images. Animals are bombarded with sensory information, and the sheer volume of visual information can be problematic. Fortunately, the visual systems of species have evolved to attend to the most-important stimuli. The importance of vision to humans is further substantiated by the fact that about one-third of the human cerebral cortex is dedicated to analyzing and perceiving visual information.
Light
As with auditory stimuli, light travels in waves. The compression waves that compose sound must travel in a medium—a gas, a liquid, or a solid. In contrast, light is composed of electromagnetic waves and needs no medium; light can travel in a vacuum (illustrated below). The behavior of light can be discussed in terms of the behavior of waves and also in terms of the behavior of the fundamental unit of light—a packet of electromagnetic radiation called a photon. A glance at the electromagnetic spectrum shows that visible light for humans is just a small slice of the entire spectrum, which includes radiation that we cannot see as light because it is below the frequency of visible red light and above the frequency of visible violet light.
Certain variables are important when discussing perception of light. Wavelength (which varies inversely with frequency) manifests itself as hue. Light at the red end of the visible spectrum has longer wavelengths (and is lower frequency), while light at the violet end has shorter wavelengths (and is higher frequency). The wavelength of light is expressed in nanometers (nm); one nanometer is one billionth of a meter. Humans perceive light that ranges between approximately 380 nm and 740 nm. Some other animals, though, can detect wavelengths outside of the human range. For example, bees see near-ultraviolet light in order to locate nectar guides on flowers, and some non-avian reptiles sense infrared light (heat that prey gives off).
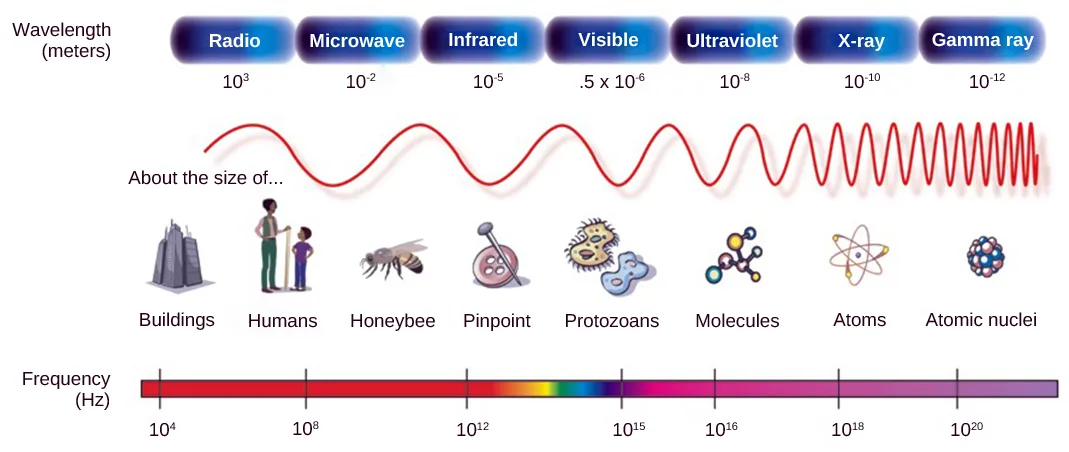
Extended description
A horizontal band across the top is divided into seven labeled segments, left to right: Radio (wavelength about 10 to the 3rd power meters), Microwave (10 to the -2 power m), Infrared (10 to the -5 power m), Visible (.5 times 10 to the -6 power m), Ultraviolet (10 to the -8 power m), X-ray (10 to the -10 power m), and Gamma ray (10 to the -12 power m). Below the band, a red sine wave runs left to right under the heading ‘About the size of…,’ its coils spaced far apart under Radio and packed increasingly tight through Gamma ray. Eight icons sit beneath the wave, one per rough size class, left to right: a cluster of buildings, a standing adult beside a child, a honeybee, a straight pin’s point, a cluster of round protozoans, a ball-and-stick molecule, an atom with orbiting electrons, and a cluster of atomic nuclei, labeled respectively Buildings, Humans, Honeybee, Pinpoint, Protozoans, Molecules, Atoms, and Atomic nuclei. A frequency scale runs along the bottom from 10 to the 4th power Hz on the left to 10 to the 20th power Hz on the right, shaded as a gradient from red through the visible spectrum to violet in the middle band and to gray at both ends.
Wave amplitude is perceived as luminous intensity, or brightness. The standard unit of intensity of light is the candela, which is approximately the luminous intensity of one common candle.
Light waves travel 299,792 km per second in a vacuum, (and somewhat slower in various media such as air and water), and those waves arrive at the eye as long (red), medium (green), and short (blue) waves. What is termed “white light” is light that is perceived as white by the human eye. This effect is produced by light that stimulates equally the color receptors in the human eye. The apparent color of an object is the color (or colors) that the object reflects. Thus a red object reflects the red wavelengths in mixed (white) light and absorbs all other wavelengths of light.
Anatomy of the Eye
The photoreceptive cells of the eye, where transduction of light to nervous impulses occurs, are located in the retina (shown below) on the inner surface of the back of the eye. But light does not impinge on the retina unaltered. It passes through other layers that process it so that it can be interpreted by the retina (illustrated in panel b below). The cornea, the front transparent layer of the eye, and the crystalline lens, a transparent convex structure behind the cornea, both refract (bend) light to focus the image on the retina. The iris, which is conspicuous as the colored part of the eye, is a circular muscular ring lying between the lens and cornea that regulates the amount of light entering the eye. In conditions of high ambient light, the iris contracts, reducing the size of the pupil at its center. In conditions of low light, the iris relaxes and the pupil enlarges.
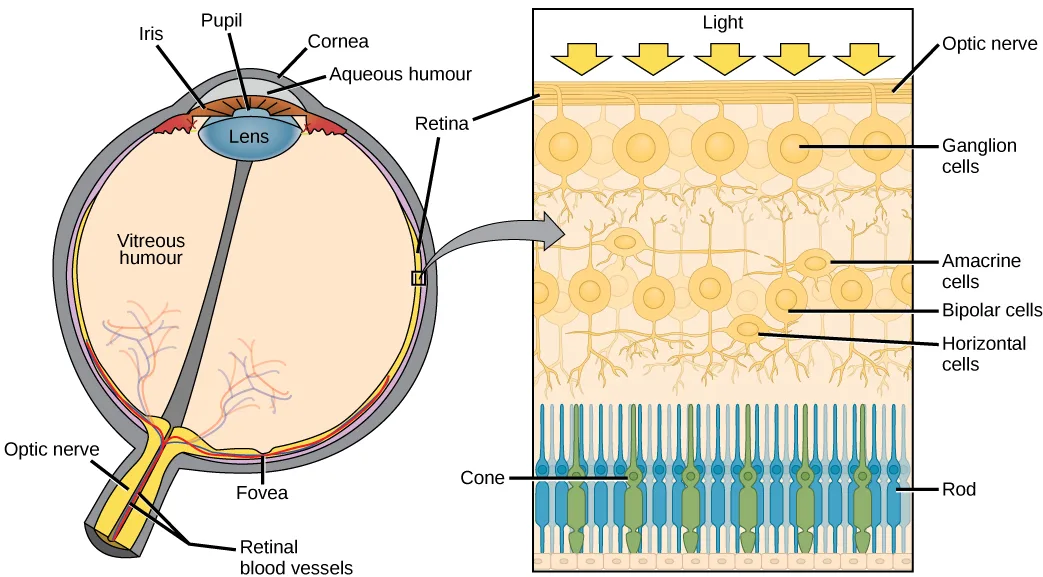
Extended description
Panel (a): a round eye in cross section, drawn front (left) to back (right). At the front, labeled left to right: Iris, Pupil, Cornea (a convex bump), with Aqueous humour labeling the space between the cornea and the iris, and Lens labeling the blue oval just behind the iris. The eye’s large interior is labeled Vitreous humour. The inner back wall is labeled Retina, with a small boxed region on it connected by a gray arrow to panel (b). At the bottom, Optic nerve labels the stalk exiting the eye, Fovea labels a small notch in the retina near the stalk, and Retinal blood vessels labels red and blue vessels running along the optic nerve stalk into the eye. Panel (b): a magnified rectangular cross-section of the retina, with five downward arrows labeled Light entering at the top. Reading top to bottom: Optic nerve labels the topmost cell layer; Ganglion cells labels the next layer of large round cell bodies; Amacrine cells and, below them, Bipolar cells and Horizontal cells label a layer of smaller branching cells; at the bottom, Cone labels the shorter green columnar cells and Rod labels the taller blue columnar cells.
Which of the following statements about the human eye is false?
Three of these claims are accurate; the odd one out swaps the roles of the eye’s color-detecting and shades-only photoreceptors.The main function of the lens is to focus light on the retina and fovea centralis. The lens is dynamic, focusing and re-focusing light as the eye rests on near and far objects in the visual field. The lens is operated by muscles that stretch it flat or allow it to thicken, changing the focal length of light coming through it to focus it sharply on the retina. With age comes the loss of the flexibility of the lens, and a form of farsightedness called presbyopia results. Presbyopia occurs because the image focuses behind the retina. Presbyopia is a deficit similar to a different type of farsightedness called hyperopia caused by an eyeball that is too short. For both defects, images in the distance are clear but images nearby are blurry. Myopia (nearsightedness) occurs when an eyeball is elongated and the image focus falls in front of the retina. In this case, images in the distance are blurry but images nearby are clear.
There are two types of photoreceptors in the retina: rods and cones, named for their general appearance as illustrated below. Rods are strongly photosensitive and are located in the outer edges of the retina. They detect dim light and are used primarily for peripheral and nighttime vision. Cones are weakly photosensitive and are located near the center of the retina. They respond to bright light, and their primary role is in daytime, color vision.
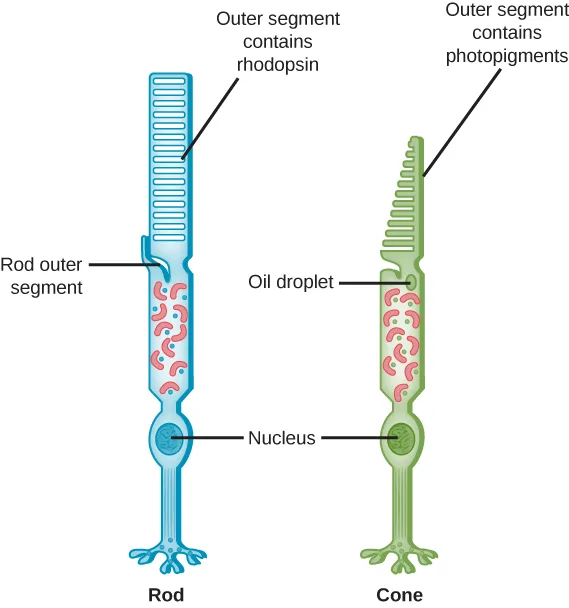
Extended description
Left, labeled ‘Rod’ beneath it: ‘Outer segment contains rhodopsin’ labels the straight stack of discs at the top; ‘Rod outer segment’ labels the narrow neck just below the disc stack; ‘Nucleus’ labels the oval body further down the cell, above its branching foot. Right, labeled ‘Cone’ beneath it: ‘Outer segment contains photopigments’ labels its tapering, comb-like stack of discs at the top; ‘Oil droplet’ labels a small circle just below the discs; ‘Nucleus’ labels the oval body further down the cell, above its own branching foot.
The fovea is the region in the center back of the eye that is responsible for acute vision. The fovea has a high density of cones. When you bring your gaze to an object to examine it intently in bright light, the eyes orient so that the object’s image falls on the fovea. However, when looking at a star in the night sky or other object in dim light, the object can be better viewed by the peripheral vision because it is the rods at the edges of the retina, rather than the cones at the center, that operate better in low light. In humans, cones far outnumber rods in the fovea.
Link to Learning
Review an interactive matching activity for the anatomical structures of the eye to practice identification.
Transduction of Light
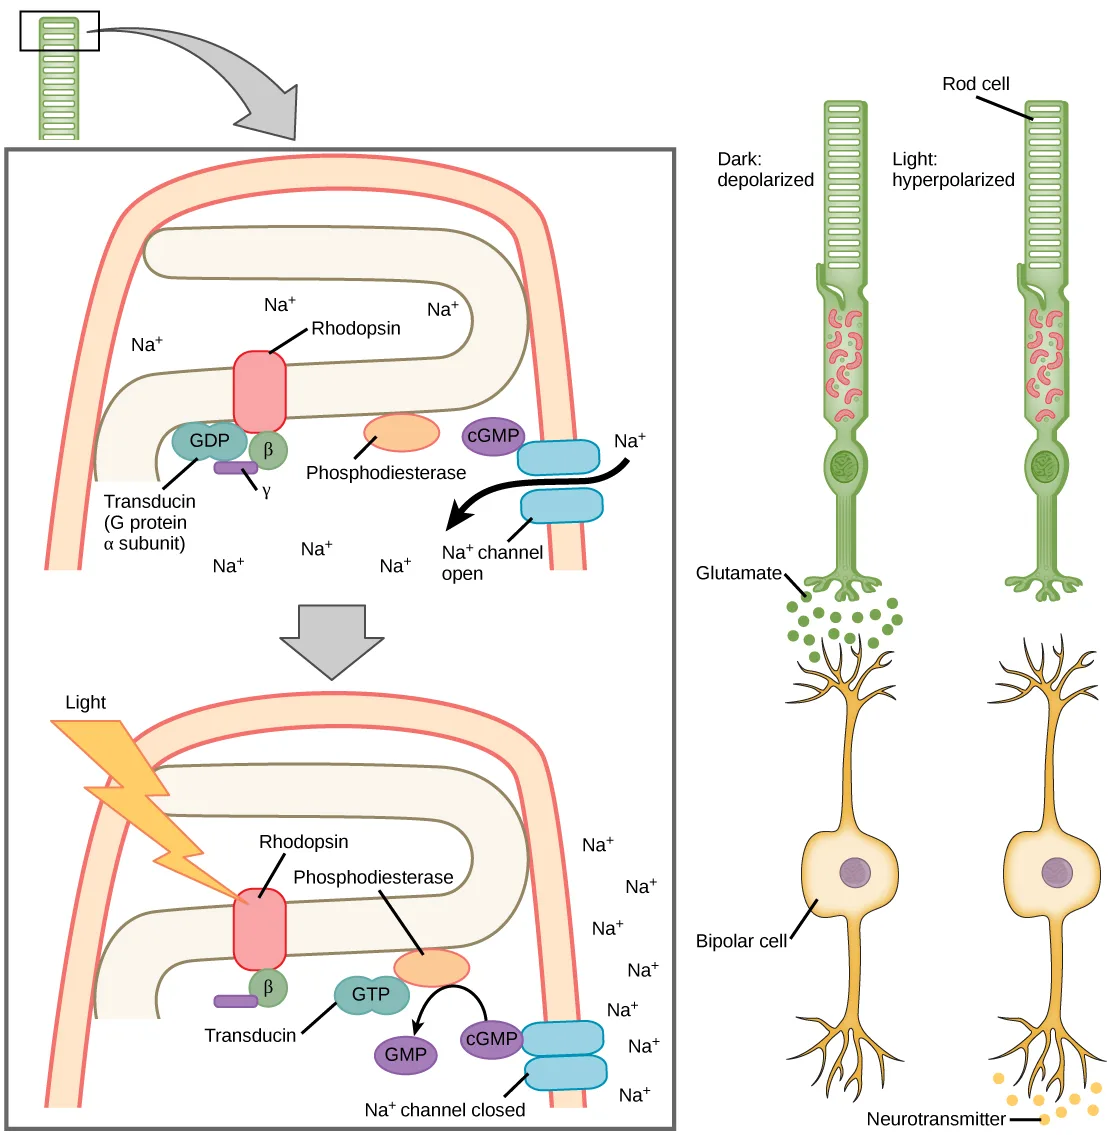
The rods and cones are the site of transduction of light to a neural signal. Both rods and cones contain photopigments. In vertebrates, the main photopigment, rhodopsin, has two main parts (shown below): an opsin, which is a membrane protein (in the form of a cluster of α-helices that span the membrane), and retinal—a molecule that absorbs light. When light hits a photoreceptor, it causes a shape change in the retinal, altering its structure from a bent (cis) form of the molecule to its linear (trans) isomer. This isomerization of retinal activates the rhodopsin, starting a cascade of events that ends with the closing of Na⁺ channels in the membrane of the photoreceptor. Thus, unlike most other sensory neurons (which become depolarized by exposure to a stimulus) visual receptors become hyperpolarized and thus driven away from threshold (illustrated below).
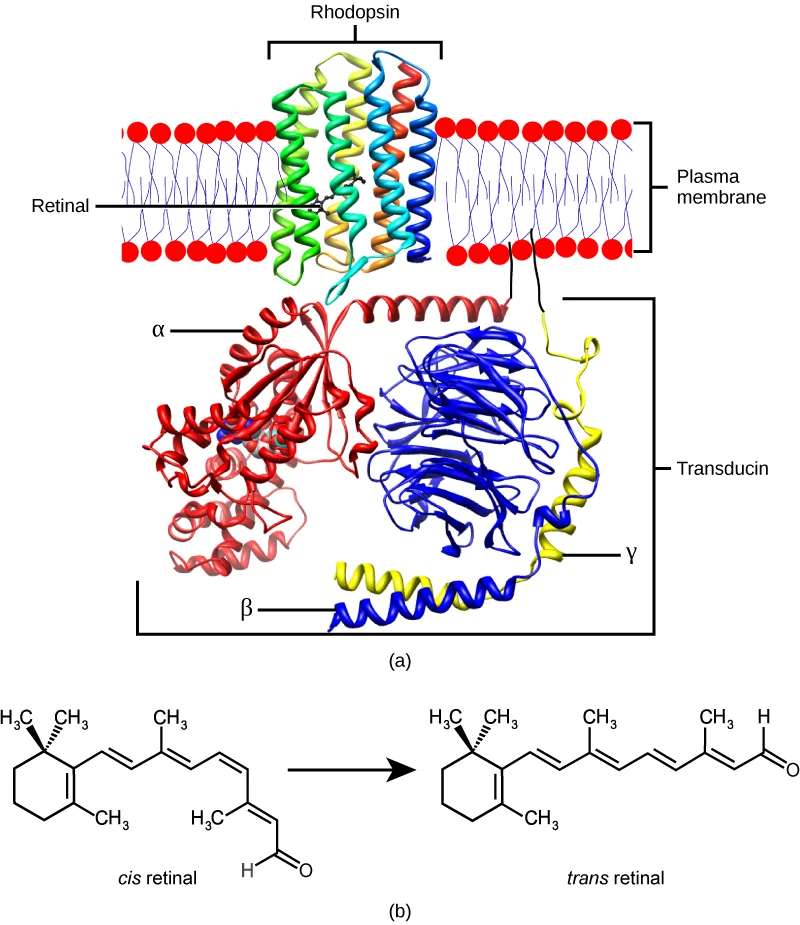
Extended description
Panel (a), bracketed ‘Rhodopsin’ at top: a rainbow-colored ribbon of seven helices spans a bilayer (two rows of red circular heads with wavy tails), bracketed ‘Plasma membrane’ at right; a lead line labeled ‘Retinal’ points to a small molecule nested among the helices. Below the membrane, a red globular subunit is labeled α, a blue globular subunit with an attached yellow helical tail is labeled β, and the yellow tail is labeled γ; all three are bracketed together as ‘Transducin,’ and the panel is labeled (a) beneath it. Panel (b), labeled (b) beneath it: at left, a six-carbon ring with three methyl branches connects to a kinked hydrocarbon chain ending in an aldehyde group, labeled ‘cis retinal’; a rightward arrow leads to, at right, the same ring connected to a straight hydrocarbon chain ending in an aldehyde group, labeled ’trans retinal.’
Extended description
Left inset, two boxed panels connected by a downward gray arrow. Upper panel (unlit): a pink oval labeled ‘Rhodopsin’ sits in the disc membrane; ‘Transducin (G protein α subunit)’ labels a teal circle bound to a purple ‘GDP’ oval, with its green ‘β’ and purple ‘γ’ subunits beside it; an orange oval is labeled ‘Phosphodiesterase’; a purple oval is labeled ‘cGMP’; a pair of blue channel segments is labeled ‘Na⁺ channel open,’ with a black arrow showing Na⁺ flowing into the cytoplasm through it; the label ‘Na⁺’ also appears seven more times scattered through the cytoplasm and extracellular space. Lower panel (lit): a yellow lightning bolt labeled ‘Light’ strikes the disc; lead lines label the same pink ‘Rhodopsin’ and orange ‘Phosphodiesterase’; ‘Transducin’ now labels a separated teal subunit bound to a teal ‘GTP’ oval, with its green ‘β’ subunit shown apart from it; a curved black arrow shows the purple ‘cGMP’ oval converting to a purple ‘GMP’ oval; the channel pair is now labeled ‘Na⁺ channel closed,’ and ‘Na⁺’ labels appear seven times in a column outside the membrane, none crossing in. Right side, under the heading ‘Rod cell’: two identical rod cells stand side by side, captioned ‘Dark: depolarized’ (left) and ‘Light: hyperpolarized’ (right). Below the left, dark rod cell’s terminal, green dots labeled ‘Glutamate’ are released onto a yellow bipolar cell beneath it, which releases nothing further below itself; below the right, light rod cell’s terminal, no dots are released, but its own bipolar cell releases orange dots labeled ‘Neurotransmitter’ from its base.
Trichromatic Coding
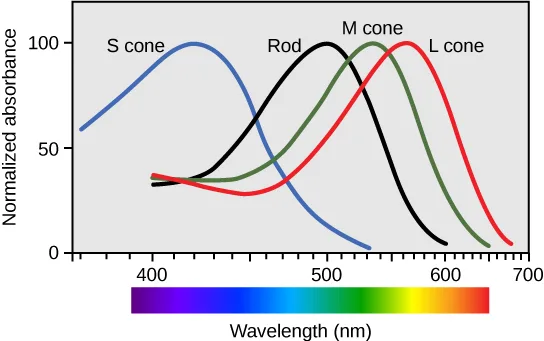
There are three types of cones (with different photopsins), and they differ in the wavelength to which they are most responsive, as shown below. Some cones are maximally responsive to short light waves of 420 nm, so they are called S cones (“S” for “short”); others respond maximally to waves of 530 nm (M cones, for “medium”); a third group responds maximally to light of longer wavelengths, at 560 nm (L, or “long” cones). With only one type of cone, color vision would not be possible, and a two-cone (dichromatic) system has limitations. Primates use a three-cone (trichromatic) system, resulting in full color vision.
The color we perceive is a result of the ratio of activity of our three types of cones. The colors of the visual spectrum, running from long-wavelength light to short, are red (700 nm), orange (600 nm), yellow (565 nm), green (497 nm), blue (470 nm), indigo (450 nm), and violet (425 nm). Humans have very sensitive perception of color and can distinguish about 500 levels of brightness, 200 different hues, and 20 steps of saturation, or about 2 million distinct colors.
Extended description
Four curves rise from a shared low baseline near 400 nm, each peaking then falling, left to right: the blue ‘S cone’ curve peaks near 420 nm; the black ‘Rod’ curve peaks near 498 nm; the olive-green ‘M cone’ curve peaks near 534 nm; the red ‘L cone’ curve peaks near 564 nm and extends furthest right, toward 680 nm. All four curves converge again near a low level past 650 nm. Below the plot, a horizontal bar shaded violet through blue, green, yellow, and red spans the 400–700 nm axis, labeled ‘Wavelength (nm).’
Retinal Processing
Visual signals leave the cones and rods, travel to the bipolar cells, and then to ganglion cells. A large degree of processing of visual information occurs in the retina itself, before visual information is sent to the brain.
Photoreceptors in the retina continuously undergo tonic activity. That is, they are always slightly active even when not stimulated by light. In neurons that exhibit tonic activity, the absence of stimuli maintains a firing rate at a baseline; while some stimuli increase firing rate from the baseline, and other stimuli decrease firing rate. In the absence of light, the bipolar neurons that connect rods and cones to ganglion cells are continuously and actively inhibited by the rods and cones. Exposure of the retina to light hyperpolarizes the rods and cones and removes their inhibition of bipolar cells. The now active bipolar cells in turn stimulate the ganglion cells, which send action potentials along their axons (which leave the eye as the optic nerve). Thus, the visual system relies on change in retinal activity, rather than the absence or presence of activity, to encode visual signals for the brain. Sometimes horizontal cells carry signals from one rod or cone to other photoreceptors and to several bipolar cells. When a rod or cone stimulates a horizontal cell, the horizontal cell inhibits more distant photoreceptors and bipolar cells, creating lateral inhibition. This inhibition sharpens edges and enhances contrast in the images by making regions receiving light appear lighter and dark surroundings appear darker. Amacrine cells can distribute information from one bipolar cell to many ganglion cells.
You can demonstrate this using an easy demonstration to “trick” your retina and brain about the colors you are observing in your visual field. Look fixedly at the flag below for about 45 seconds. Then quickly shift your gaze to a sheet of blank white paper or a white wall. You should see an afterimage of the Norwegian flag in its correct colors. At this point, close your eyes for a moment, then reopen them, looking again at the white paper or wall; the afterimage of the flag should continue to appear as red, white, and blue. What causes this? According to an explanation called opponent process theory, as you gazed fixedly at the green, black, and yellow flag, your retinal ganglion cells that respond positively to green, black, and yellow increased their firing dramatically. When you shifted your gaze to the neutral white ground, these ganglion cells abruptly decreased their activity and the brain interpreted this abrupt downshift as if the ganglion cells were responding now to their “opponent” colors: red, white, and blue, respectively, in the visual field. Once the ganglion cells return to their baseline activity state, the false perception of color will disappear.

Higher Processing
The myelinated axons of ganglion cells make up the optic nerves. Within the nerves, different axons carry different qualities of the visual signal. Some axons constitute the magnocellular (big cell) pathway, which carries information about form, movement, depth, and differences in brightness. Other axons constitute the parvocellular (small cell) pathway, which carries information on color and fine detail. Some visual information projects directly back into the brain, while other information crosses to the opposite side of the brain. This crossing of optical pathways produces the distinctive optic chiasma (Greek, for “crossing”) found at the base of the brain and allows us to coordinate information from both eyes.
Once in the brain, visual information is processed in several places, and its routes reflect the complexity and importance of visual information to humans and other animals. One route takes the signals to the thalamus, which serves as the routing station for all incoming sensory impulses except olfaction. In the thalamus, the magnocellular and parvocellular distinctions remain intact, and there are different layers of the thalamus dedicated to each. When visual signals leave the thalamus, they travel to the primary visual cortex at the rear of the brain. From the visual cortex, the visual signals travel in two directions. One stream that projects to the parietal lobe, in the side of the brain, carries magnocellular (“where”) information. A second stream projects to the temporal lobe and carries both magnocellular (“where”) and parvocellular (“what”) information.
Another important visual route is a pathway from the retina to the superior colliculus in the midbrain, where eye movements are coordinated and integrated with auditory information. Finally, there is the pathway from the retina to the suprachiasmatic nucleus (SCN) of the hypothalamus. The SCN is a cluster of cells that is considered to be the body’s internal clock, which controls our circadian (day-long) cycle. The SCN sends information to the pineal gland, which is important in sleep/wake patterns and annual cycles.
Link to Learning
View an interactive presentation reviewing how vision functions.
Summary
Vision is the only photo responsive sense. Visible light travels in waves and is a very small slice of the electromagnetic radiation spectrum. Light waves differ based on their frequency (wavelength = hue) and amplitude (intensity = brightness).
In the vertebrate retina, there are two types of light receptors (photoreceptors): cones and rods. Cones, which are the source of color vision, exist in three forms—L, M, and S—and they are differentially sensitive to different wavelengths. Cones are located in the retina, along with the dim-light, achromatic receptors (rods). Cones are found in the fovea, the central region of the retina, whereas rods are found in the peripheral regions of the retina.
Visual signals travel from the eye over the axons of retinal ganglion cells, which make up the optic nerves. Ganglion cells come in several versions. Some ganglion cell axons carry information on form, movement, depth, and brightness, while other axons carry information on color and fine detail. Visual information is sent to the superior colliculi in the midbrain, where coordination of eye movements and integration of auditory information takes place. Visual information is also sent to the suprachiasmatic nucleus (SCN) of the hypothalamus, which plays a role in the circadian cycle.
Key terms
- candela — (cd) unit of measurement of luminous intensity (brightness).
- circadian — describes a time cycle about one day in length.
- cone — weakly photosensitive, chromatic, cone-shaped neuron in the fovea of the retina that detects bright light and is used in daytime color vision.
- cornea — transparent layer over the front of the eye that helps focus light waves.
- fovea — region in the center of the retina with a high density of photoreceptors and which is responsible for acute vision.
- hyperopia — (also, farsightedness) visual defect in which the image focus falls behind the retina, thereby making images in the distance clear, but close-up images blurry.
- iris — pigmented, circular muscle at the front of the eye that regulates the amount of light entering the eye.
- lens — transparent, convex structure behind the cornea that helps focus light waves on the retina.
- myopia — (also, nearsightedness) visual defect in which the image focus falls in front of the retina, thereby making images in the distance blurry, but close-up images clear.
- presbyopia — visual defect in which the image focus falls behind the retina, thereby making images in the distance clear, but close-up images blurry; caused by age-based changes in the lens.
- pupil — small opening through which light enters.
- retina — layer of photoreceptive and supporting cells on the inner surface of the back of the eye.
- rhodopsin — main photopigment in vertebrates.
- rod — strongly photosensitive, achromatic, cylindrical neuron in the outer edges of the retina that detects dim light and is used in peripheral and nighttime vision.
- superior colliculus — paired structure in the top of the midbrain, which manages eye movements and auditory integration.
- suprachiasmatic nucleus — cluster of cells in the hypothalamus that plays a role in the circadian cycle.
- tonic activity — in a neuron, slight continuous activity while at rest.
- vision — sense of sight.
Practice
Explain how electromagnetic waves differ from sound waves
A satellite is launched into space, but explodes after exiting the Earth’s atmosphere. Which statement accurately reflects the observations made by an astronaut on a space walk outside the International Space Station during the explosion?
Compare what each kind of wave needs in order to travel: one of the two needs a physical medium to propagate, and outside the station there isn’t one.The unit of measurement of luminous intensity, or brightness, approximately equal to the intensity of one common candle, is called the ________.
This is the light-wave counterpart to a sound wave’s decibel — it measures amplitude, not wavelength.The general sense that includes the ability to detect light patterns from the outside environment and interpret them into images is called ________.
About one-third of the human cerebral cortex is dedicated to processing this one sense alone.Visible light travels in waves and is a very small slice of the ________.
The full range runs from radio waves at one end to gamma rays at the other; what we can see is only a sliver of it.Trace the path of light through the eye to the point of the optic nerve
Why do people over 55 often need reading glasses?
This is the same age-related process as presbyopia — think about which internal structure loses its flexibility over time, rather than the eye’s outer window or its overall shape.Why is it easier to see images at night using peripheral, rather than the central, vision?
Peripheral vision depends on whichever photoreceptor type is strongly light-sensitive and works best in dim conditions — and that type is scarce at the fovea.A person catching a ball must coordinate her hand and eyes. What part of the brain is helping to do this?
This midbrain structure coordinates eye movements with auditory information — it is not the general sensory routing station, and not the gland tied to sleep and annual cycles.Cataracts, the medical condition where the lens of the eye becomes cloudy, are a leading cause of blindness. Describe how developing a cataract would change the path of light through the eye.
Show model answer
Did your answer mention:
How could the pineal gland, the brain structure that plays a role in annual cycles, use visual information from the suprachiasmatic nucleus of the hypothalamus?
Show model answer
Did your answer mention:
The transparent front layer of the eye that, along with the lens, refracts light to help focus the image on the retina is called the ________.
This structure sits in front of the iris and pupil, forming the convex bump at the very front of the eye.The pigmented, circular muscle lying between the lens and cornea that regulates the amount of light entering the eye is called the ________.
This structure contracts in bright light to shrink the opening at its center and relaxes in dim light to enlarge it.The transparent, convex structure behind the cornea that focuses light on the retina, changing shape as its muscles stretch or thicken it, is called the ________.
Losing this structure’s flexibility with age is what causes presbyopia.The layer of photoreceptive and supporting cells on the inner surface of the back of the eye, where light is converted into a nervous signal, is called the ________.
Light passes through the cornea and other layers before finally reaching this structure lining the rear interior of the eye.The visual defect in which an elongated eyeball causes the image focus to fall in front of the retina — making distant objects blurry but close-up objects clear — is called ________.
This is the opposite eyeball-length problem from the section’s two ‘farsightedness’ conditions.Explain tonic activity as it is manifested in photoreceptors in the retina
How is the relationship between photoreceptors and bipolar cells different from other sensory receptors and adjacent cells?
Show model answer
Did your answer mention:
The slight, continuous activity a neuron shows even at rest, before any stimulus arrives, is called ________.
Photoreceptors show this baseline firing constantly; a stimulus then raises or lowers the rate from that baseline instead of switching it on from zero.The strongly photosensitive, achromatic photoreceptor located in the outer edges of the retina that detects dim light and supports peripheral and nighttime vision is called a ________.
This photoreceptor type outnumbers its color-detecting counterpart at the retina’s edges but is scarce at the fovea.The weakly photosensitive, chromatic photoreceptor located near the center of the retina that responds to bright light and supports daytime color vision is called a ________.
This photoreceptor type is concentrated at the fovea and comes in three varieties tuned to different wavelengths.This section is adapted from Biology 2e, Section 36.5: Vision by Mary Ann Clark, Jung Choi, Matthew Douglas, and OpenStax, © OpenStax, licensed under CC BY-NC-SA 4.0. Access the original for free at openstax.org. Changes: figures re-encoded as WebP; six figures re-kinded from the manifest’s file-extension “photo” guess to “diagram” (Figure_36_05_01, Figure_36_05_04, Figure_36_05_06, Figure_36_05_07, Figure_B36_05_03, and Figure_B36_05_07ab are all illustrations, a molecular-ribbon rendering, a data graph, or a flat-color graphic, none a captured photograph); alts rewritten from the manifest’s source text to plain visual descriptions where it named the print figure letters without saying what each panel shows, with counted, label-by-label longdescs added to the electromagnetic-spectrum diagram, the Visual Connection eye/retina diagram, the rod-and-cone diagram, the rhodopsin/retinal-isomerization diagram, the phototransduction-cascade and dark/light rod-bipolar diagram, and the cone/rod absorbance graph — transcribing each drawing’s own printed labels and peak values and counting its panels, subunits, or repeated ion labels; the Visual Connection note copy (fs-idp52568064) and the Visual Connection Questions exercise copy (fs-idp141411600) print identical option wording, so the exercise copy is used as printed with no correction needed; the two Link to Learning notes rendered as callouts with descriptive link text in place of the source’s “anatomical structure” and “presentation” anchors, external URLs kept as printed; in-text pointers to figures (“Figure 36.17” through “Figure 36.23”) replaced with “shown below,” “illustrated below,” or “look fixedly at the flag below,” since Hugo does not number figures; the Visual Connection item kept in the body as a mediafigure followed by a multiple choice, since the source keys it as a lettered choice; the end-of-section Review Questions and Critical Thinking Questions adapted into the closing interactive Practice block (multiple choice and self-check respectively), and every one of the four Review Questions, the Visual Connection, and all three Critical Thinking Questions used at least once; rubric checkpoints added to each self-check, decomposing its model answer (the source solution) into check-off clauses with no new claims; ten key-term recall items added from the glossary (candela, vision, cornea, iris, lens, retina, myopia, tonic activity, rod, cone); the remaining eight terms (circadian, fovea, hyperopia, presbyopia, pupil, rhodopsin, superior colliculus, suprachiasmatic nucleus) appear only in the Key terms list; one summary-derived textin cloze added to the first objective’s group (blanking “electromagnetic radiation spectrum” from the closing summary’s sentence “Visible light travels in waves and is a very small slice of the electromagnetic radiation spectrum”); ion notation set as a Unicode superscript (Na⁺) in place of the source’s <sup>+</sup> markup, per house notation; the myopia textin’s accept list adds the section’s own “nearsightedness” synonym.