Climate and the Effects of Global Climate Change
By the end of this section, you will be able to:
- Define global climate change
- Summarize the effects of the Industrial Revolution on global atmospheric carbon dioxide concentration
- Describe three natural factors affecting long-term global climate
- List two or more greenhouse gases and describe their role in the greenhouse effect
All biomes are universally affected by global conditions, such as climate, that ultimately shape each biome’s environment. Scientists who study climate have noted a series of marked changes that have gradually become increasingly evident during the last sixty years. Global climate change is the term used to describe altered global weather patterns, especially a worldwide increase in temperature and resulting changes in the climate, due largely to rising levels of atmospheric carbon dioxide.
Climate and Weather
A common misconception about global climate change is that a specific weather event occurring in a particular region (for example, a very cool week in June in central Indiana) provides evidence of global climate change. However, a cold week in June is a weather-related event and not a climate-related one. These misconceptions often arise because of confusion over the terms climate and weather.
Climate refers to the long-term, predictable atmospheric conditions of a specific area. The climate of a biome is characterized by having consistent seasonal temperature and rainfall ranges. Climate does not address the amount of rain that fell on one particular day in a biome or the colder-than-average temperatures that occurred on one day. In contrast, weather refers to the conditions of the atmosphere during a short period of time. Weather forecasts are usually made for 48-hour cycles. Long-range weather forecasts are available but can be unreliable.
To better understand the difference between climate and weather, imagine that you are planning an outdoor event in northern Wisconsin. You would be thinking about climate when you plan the event in the summer rather than the winter because you have long-term knowledge that any given Saturday in the months of May to August would be a better choice for an outdoor event in Wisconsin than any given Saturday in January. However, you cannot determine the specific day that the event should be held on because it is difficult to accurately predict the weather on a specific day. Climate can be considered “average” weather that takes place over many years.
Global Climate Change
Climate change can be understood by approaching three areas of study:
- evidence of current and past global climate change
- drivers of global climate change
- documented results of climate change
It is helpful to keep these three different aspects of climate change clearly separated when consuming media reports about global climate change. We should note that it is common for reports and discussions about global climate change to confuse the data showing that Earth’s climate is changing with the factors that drive this climate change.
Evidence for Global Climate Change
Since scientists cannot go back in time to directly measure climatic variables, such as average temperature and precipitation, they must instead indirectly measure temperature. To do this, scientists rely on historical evidence of Earth’s past climate.
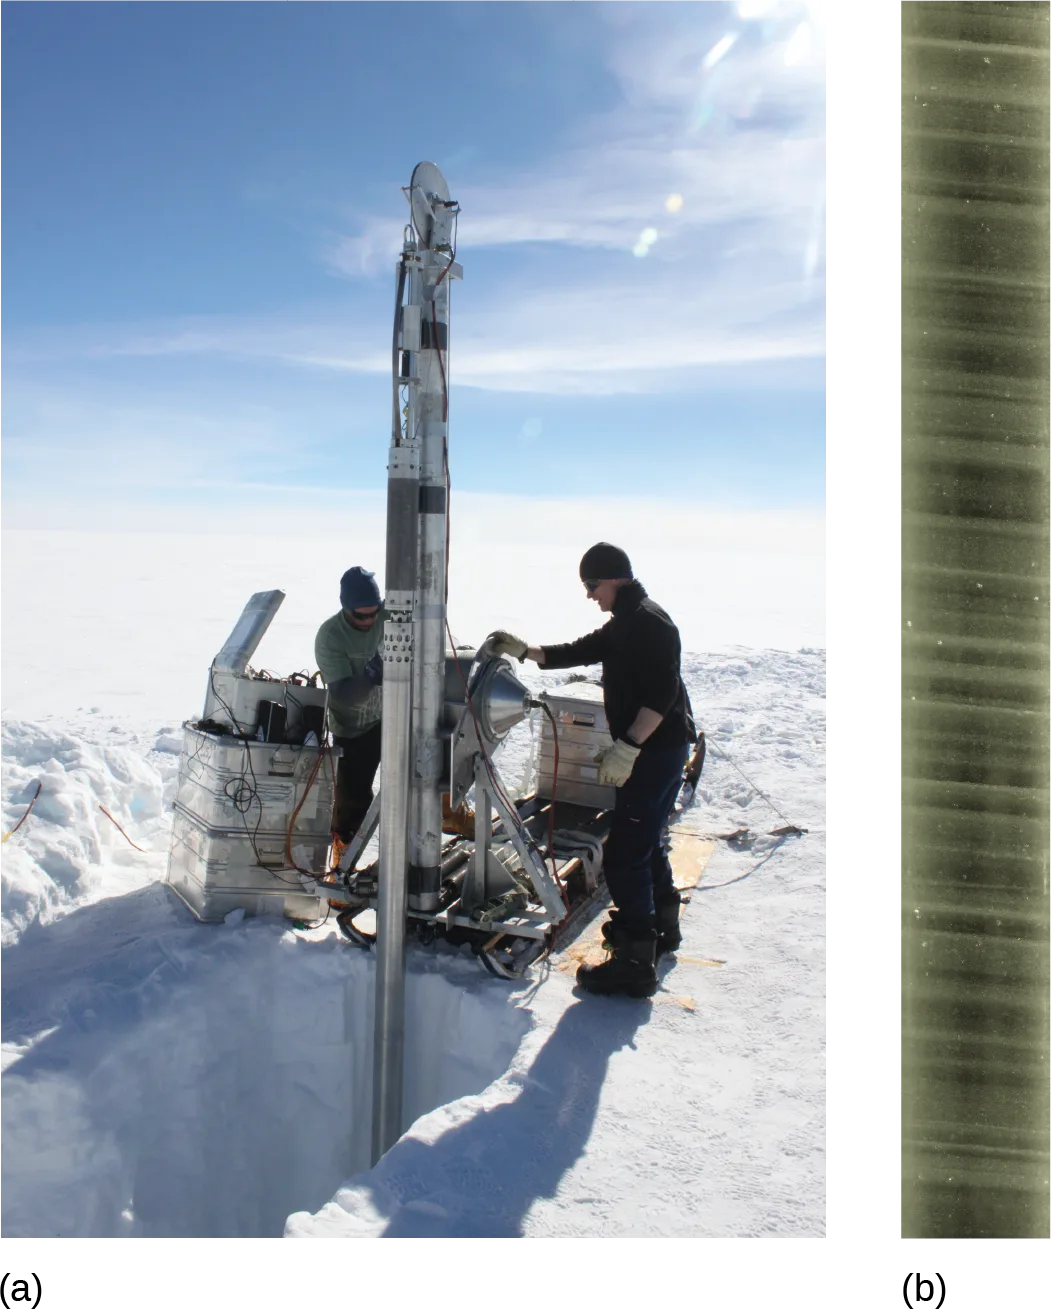
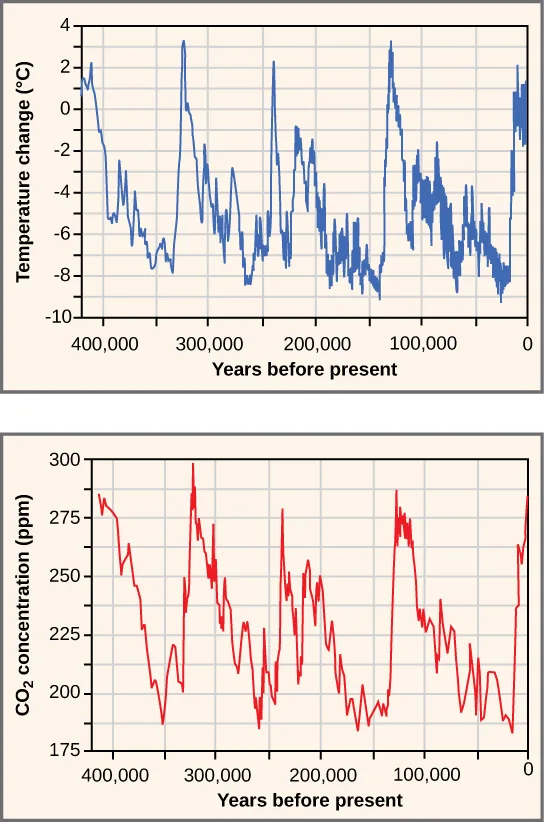
Antarctic ice cores are a key example of such evidence for climate change. These ice cores are samples of polar ice obtained by means of drills that reach thousands of meters into ice sheets or high mountain glaciers. Viewing the ice cores is like traveling backwards through time; the deeper the sample, the earlier the time period. Trapped within the ice are air bubbles and other biological evidence that can reveal temperature and carbon dioxide data. Antarctic ice cores have been collected and analyzed to indirectly estimate the temperature of the Earth over the past 400,000 years, shown below.
The data represented in the graph below is an example of such analyses. The 0 °C on this graph refers to the long-term average. Temperatures that are greater than 0 °C exceed Earth’s long-term average temperature. Conversely, temperatures that are less than 0 °C are less than Earth’s average temperature. This figure shows that there have been periodic cycles of increasing and decreasing temperature.
Extended description
Two stacked line graphs share the x-axis label Years before present, printed left to right in four steps of 400,000, 300,000, 200,000, and 100,000 before reaching 0 at the right edge. The upper graph’s y-axis, Temperature change (°C), is printed from −10 to 4 in steps of 2; its single blue line rises and falls through four broad cycles across the plotted span, each crest reaching roughly 2 °C to 3 °C above the 0 °C baseline and each trough falling to roughly −6 °C to −9 °C below it, with the line’s final, steepest rise cut off partway up near the right edge. The lower graph’s y-axis, CO2 concentration (ppm), is printed from 175 to 300 in steps of 25; its single red line traces the same four-cycle pattern in step with the upper line, cresting near 275–300 ppm and dropping to roughly 180–200 ppm at each trough, also cut off partway up its final rise at the right edge.
Before the late 1800s, the Earth has been as much as 9 °C cooler and about 3 °C warmer. Note that the lower graph above shows that the atmospheric concentration of carbon dioxide has also risen and fallen in periodic cycles. Also note the relationship between carbon dioxide concentration and temperature — the same graph shows that carbon dioxide levels in the atmosphere have historically cycled between 180 and 300 parts per million (ppm) by volume.
The temperature graph above does not show the last 2,000 years with enough detail to compare the changes of Earth’s temperature during the last 400,000 years with the temperature change that has occurred in the more recent past. Two significant temperature anomalies, or irregularities, have occurred in the last 2,000 years. These are the Medieval Climate Anomaly (or the Medieval Warm Period) and the Little Ice Age. A third temperature anomaly aligns with the Industrial Era. The Medieval Climate Anomaly occurred between 900 and 1300 AD. During this time period, many climate scientists think that slightly warmer weather conditions prevailed in many parts of the world; the higher-than-average temperature changes varied between 0.10 °C and 0.20 °C above the norm. Although 0.10 °C does not seem large enough to produce any noticeable change, it did free seas of ice. Because of this warming, the Vikings were able to colonize Greenland.
The Little Ice Age was a cold period that occurred between 1550 AD and 1850 AD. During this time, a slight cooling of a little less than 1 °C was observed in North America, Europe, and possibly other areas of the Earth. This 1 °C change in global temperature is a seemingly small deviation in temperature (as was observed during the Medieval Climate Anomaly); however, it also resulted in noticeable climatic changes. Historical accounts reveal a time of exceptionally harsh winters with much snow and frost.
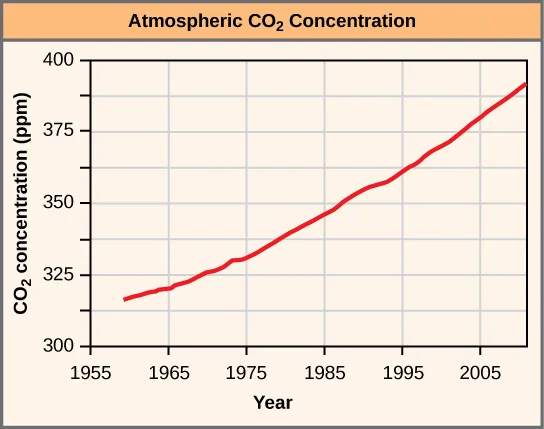
The Industrial Revolution, which began around 1750, was characterized by changes in much of human society. Advances in agriculture increased the food supply, which improved the standard of living for people in Europe and the United States. New technologies were invented that provided jobs and cheaper goods. These new technologies were powered using fossil fuels, especially coal. The Industrial Revolution starting in the early nineteenth century ushered in the beginning of the Industrial Era. When a fossil fuel is burned, carbon dioxide is released. With the beginning of the Industrial Era, atmospheric carbon dioxide began to rise, shown below.
Extended description
A line graph titled Atmospheric CO2 Concentration. The y-axis, CO2 concentration (ppm), is printed from 300 to 400 in steps of 25; the x-axis, Year, is printed at 1955, 1965, 1975, 1985, 1995, and 2005. A single red line begins at roughly 315 ppm near 1958 and climbs without interruption to roughly 390 ppm at the graph’s right edge, near 2008, with the line’s upward slope increasing slightly through the second half of the plotted years.
Current and Past Drivers of Global Climate Change
Because it is not possible to go back in time to directly observe and measure climate, scientists must use indirect evidence to determine the drivers, or factors, that may be responsible for climate change. The indirect evidence includes data collected using ice cores, boreholes (a narrow shaft bored into the ground), tree rings, glacier lengths, pollen remains, and ocean sediments. The data shows a correlation between the timing of temperature changes and drivers of climate change. Before the Industrial Era (pre-1780), there were three drivers of climate change that were not related to human activity or atmospheric gases. The first of these is the Milankovitch cycles. The Milankovitch cycles describe the effects of slight changes in the Earth’s orbit on Earth’s climate. The length of the Milankovitch cycles ranges between 19,000 and 100,000 years. In other words, one could expect to see some predictable changes in the Earth’s climate associated with changes in the Earth’s orbit at a minimum of every 19,000 years.
The variation in the sun’s intensity is the second natural factor responsible for climate change. Solar intensity is the amount of solar power or energy the sun emits in a given amount of time. There is a direct relationship between solar intensity and temperature. As solar intensity increases (or decreases), the Earth’s temperature correspondingly increases (or decreases). Changes in solar intensity have been proposed as one of several possible explanations for the Little Ice Age.
Finally, volcanic eruptions are a third natural driver of climate change. Volcanic eruptions can last a few days, but the solids and gases released during an eruption can influence the climate over a period of a few years, causing short-term climate changes. The gases and solids released by volcanic eruptions can include carbon dioxide, water vapor, sulfur dioxide, hydrogen sulfide, hydrogen, and carbon monoxide. Generally, volcanic eruptions cool the climate. This occurred in 1783 when volcanoes in Iceland erupted and caused the release of large volumes of sulfuric oxide. This led to haze-effect cooling, a global phenomenon that occurs when dust, ash, or other suspended particles block out sunlight and trigger lower global temperatures as a result; haze-effect cooling usually extends for one or more years before dissipating in intensity. In Europe and North America, haze-effect cooling produced some of the lowest average winter temperatures on record in 1783 and 1784.
Greenhouse gases are probably the most significant drivers of the climate. When heat energy from the sun strikes the Earth, gases known as greenhouse gases trap the heat in the atmosphere, in a similar manner as do the glass panes of a greenhouse keep heat from escaping. The greenhouse gases that affect Earth include carbon dioxide, methane, water vapor, nitrous oxide, and ozone. Approximately half of the radiation from the sun passes through these gases in the atmosphere and strikes the Earth. This radiation is converted into thermal (infrared) radiation on the Earth’s surface, and then a portion of that energy is re-radiated back into the atmosphere. Greenhouse gases, however, reflect much of the thermal energy back to the Earth’s surface. The more greenhouse gases there are in the atmosphere, the more thermal energy is reflected back to the Earth’s surface, heating it up and the atmosphere immediately above it. Greenhouse gases absorb and emit radiation and are an important factor in the greenhouse effect: the warming of Earth due to carbon dioxide and other greenhouse gases in the atmosphere.
Direct evidence supports the relationship between atmospheric concentrations of carbon dioxide and temperature: as carbon dioxide rises, global temperature rises. Since 1950, the concentration of atmospheric carbon dioxide has increased from about 310 ppm to 382 ppm in 2006. (Source note: the source says “from about 280 ppm”; 280 ppm is the pre-industrial value, and the Law Dome ice-core record puts 1950 at about 310 ppm (MacFarling Meure et al., Geophysical Research Letters 33 [2006]: L14810).) In 2011, the atmospheric carbon dioxide concentration was 392 ppm. However, the planet would not be inhabitable by current life forms if water vapor did not produce its drastic greenhouse warming effect.
Scientists look at patterns in data and try to explain differences or deviations from these patterns. The atmospheric carbon dioxide data reveal a historical pattern of carbon dioxide increasing and decreasing, cycling between a low of 180 ppm and a high of 300 ppm. Scientists have concluded that it took around 50,000 years for the atmospheric carbon dioxide level to increase from its low minimum concentration to its higher maximum concentration. However, beginning only a few centuries ago, atmospheric carbon dioxide concentrations have increased beyond the historical maximum of 300 ppm. The current increases in atmospheric carbon dioxide have happened very quickly—in a matter of hundreds of years rather than thousands of years. What is the reason for this difference in the rate of change and the amount of increase in carbon dioxide? A key factor that must be recognized when comparing the historical data and the current data is the presence and industrial activities of modern human society; no other driver of climate change has yielded changes in atmospheric carbon dioxide levels at this rate or to this magnitude.
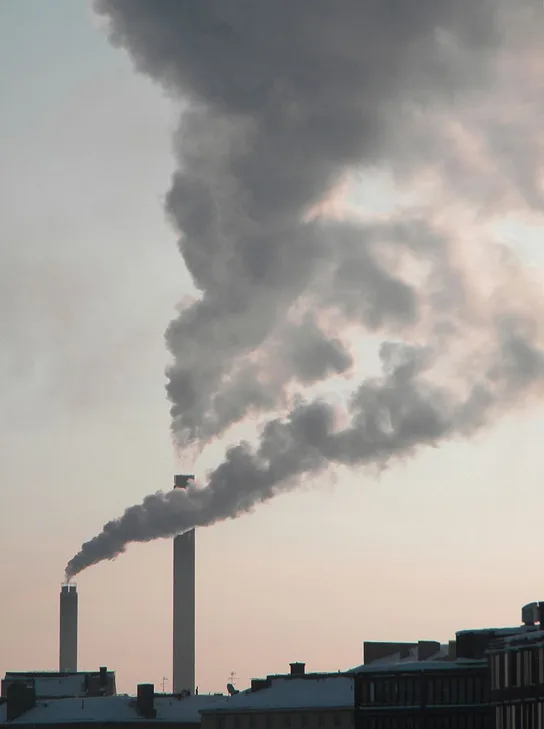
Human activity releases carbon dioxide and methane, two of the most important greenhouse gases, into the atmosphere in several ways. The primary mechanism that releases carbon dioxide is the burning of fossil fuels, such as gasoline, coal, and natural gas, shown below.
Deforestation, cement manufacture, animal agriculture, the clearing of land, and the burning of forests are other human activities that release carbon dioxide. Methane (CH₄) is produced when bacteria break down organic matter under anaerobic conditions. Anaerobic conditions can happen when organic matter is trapped underwater (such as in rice paddies) or in the intestines of herbivores. Methane can also be released from natural gas fields and the decomposition of animal and plant material that occurs in landfills. Another source of methane is the melting of clathrates. Clathrates are frozen chunks of ice and methane found at the bottom of the ocean. When water warms, these chunks of ice melt and methane is released. As the ocean’s water temperature increases, the rate at which clathrates melt is increasing, releasing even more methane. This leads to increased levels of methane in the atmosphere, which further accelerates the rate of global warming. This is an example of the positive feedback loop that is leading to the rapid rate of increase of global temperatures.
Documented Results of Climate Change: Past and Present
Scientists have geological evidence of the consequences of long-ago climate change. Modern-day phenomena such as retreating glaciers and melting polar ice cause a continual rise in sea level. Meanwhile, changes in climate can negatively affect organisms.
Geological Climate Change
Global warming has been associated with at least one planet-wide extinction event during the geological past. The Permian extinction event occurred about 251 million years ago toward the end of the roughly 50-million-year-long geological time span known as the Permian period. This geologic time period was one of the three warmest periods in Earth’s geologic history. Scientists estimate that approximately 70 percent of the terrestrial plant and animal species and 84 percent of marine species became extinct, vanishing forever near the end of the Permian period.
Organisms that had adapted to wet and warm climatic conditions, such as annual rainfall of 300–400 cm (118–157 in) and 20 °C–30 °C (68 °F–86 °F) in the tropical wet forest, may not have been able to survive the Permian climate change.
Link to Learning
Watch a NASA video about the mixed effects of global warming on plant growth. While scientists found that warmer temperatures in the 1980s and 1990s caused an increase in plant productivity, this advantage has since been counteracted by more frequent droughts.
Present Climate Change
A number of global events have occurred that may be attributed to climate change during our lifetimes. Glacier National Park in Montana is undergoing the retreat of many of its glaciers, a phenomenon known as glacier recession. In 1850, the area contained approximately 150 glaciers. By 2010, however, the park contained only about 24 glaciers greater than 25 acres in size. One of these glaciers is the Grinnell Glacier, shown below, at Mount Gould.
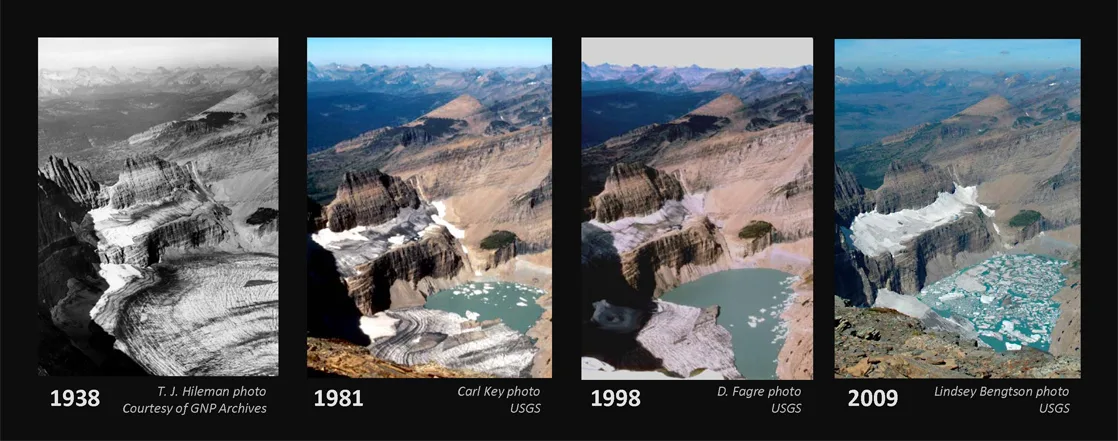
Extended description
Reading left to right, each panel is labeled with its year and photographer credit as printed on the image: 1938, T. J. Hileman photo, courtesy of GNP Archives; 1981, Carl Key photo, USGS; 1998, D. Fagre photo, USGS; 2009, Lindsey Bengtson photo, USGS.
Between 1966 and 2005, the size of Grinnell Glacier shrank by 40 percent. Similarly, the mass of the ice sheets in Greenland and the Antarctic is decreasing: Greenland lost 150–250 km³ of ice per year between 2002 and 2006. In addition, the size and thickness of the Arctic sea ice is decreasing.
This loss of ice is leading to increases in the global sea level. On average, the sea is rising at a rate of 1.8 mm per year. However, between 1993 and 2010 the rate of sea level increase ranged between 2.9 and 3.4 mm per year. A variety of factors affect the volume of water in the ocean, especially the temperature of the water (the density of water is related to its temperature: water volume expands as it warms, thus raising sea levels), as well as the amount of water found in rivers, lakes, glaciers, polar ice caps, and sea ice. As glaciers and polar ice caps melt, there is a significant contribution of liquid water that was previously frozen.
In addition to some abiotic conditions changing in response to climate change, many organisms are also being affected by the changes in temperature. Temperature and precipitation play key roles in determining the geographic distribution and phenology of plants and animals. (Phenology is the study of the effects of climatic conditions on the timing of periodic life cycle events, such as flowering in plants or migration in birds.) Researchers have shown that 385 plant species in Great Britain are flowering 4.5 days sooner than was recorded earlier during the previous 40 years. In addition, insect-pollinated species were more likely to flower earlier than wind-pollinated species. The impact of changes in flowering date would be mitigated if the insect pollinators emerged earlier. This mismatched timing of plants and pollinators could result in injurious ecosystem effects because, for continued survival, insect-pollinated plants must flower when their pollinators are present.
Summary
The Earth has gone through periodic cycles of increases and decreases in temperature. During the past 2,000 years, the Medieval Climate Anomaly was a warmer period, while the Little Ice Age was unusually cool. Both of these irregularities can be explained by natural causes of changes in climate, and, although the temperature changes were small, they had significant effects. Natural drivers of climate change include Milankovitch cycles, changes in solar activity, and volcanic eruptions. None of these factors, however, leads to rapid increases in global temperature or sustained increases in carbon dioxide.
The burning of fossil fuels is an important source of greenhouse gases, which play a major role in the greenhouse effect. Two hundred and fifty million years ago, global warming resulted in the Permian extinction: a large-scale extinction event that is documented in the fossil record. Currently, modern-day climate change is associated with the increased melting of glaciers and polar ice sheets, resulting in a gradual increase in sea level. Plants and animals can also be affected by global climate change when the timing of seasonal events, such as flowering or pollination, is affected by global warming.
Key terms
- clathrates — frozen chunks of ice and methane found at the bottom of the ocean
- climate — long-term, predictable atmospheric conditions present in a specific area
- global climate change — altered global weather patterns, including a worldwide increase in temperature, due largely to rising levels of atmospheric carbon dioxide
- greenhouse effect — warming of Earth due to carbon dioxide and other greenhouse gases in the atmosphere
- greenhouse gases — atmospheric gases such as carbon dioxide and methane that absorb and emit radiation, thus trapping heat in Earth’s atmosphere
- haze-effect cooling — effect of the gases and solids from a volcanic eruption on global climate
- Milankovitch cycles — cyclic changes in the Earth’s orbit that may affect climate
- solar intensity — amount of solar power or energy the sun emits in a given amount of time
- weather — conditions of the atmosphere during a short period of time
Practice
Define global climate change
Which of the following is an example of a weather event?
Three of these four statements describe a pattern that holds true across years or decades; only one names something that happened on one specific date — that is the hallmark of weather, not climate.The term for altered global weather patterns, including a worldwide rise in temperature, driven largely by rising atmospheric carbon dioxide levels, is ________.
This is the broad, lasting pattern the whole section describes, not any single storm or season.The long-term, predictable atmospheric conditions typical of a specific area are called ________.
Contrast this with the short-term, harder-to-predict conditions of a single day — this term is the opposite of that, the ‘average’ taken over many years.The conditions of the atmosphere during a short period of time, such as a single day or a 48-hour forecast, are called ________.
This is what changes from one day to the next and is difficult to predict far in advance.Summarize the effects of the Industrial Revolution on global atmospheric carbon dioxide concentration
According to this section, how has the atmospheric concentration of CO₂ changed since the beginning of industrialization?
The section’s own graph of CO₂ concentration by year, spanning the mid-1950s to the mid-2000s, traces a single continuous direction with no reversals.What did this section identify as the trigger for atmospheric carbon dioxide beginning to rise at the start of the Industrial Era?
The paragraph introducing the Industrial Era names one human activity as the direct cause, right before pointing to the rising graph — the other three options are natural drivers the section covers afterward.Predict possible consequences if carbon emissions from fossil fuels continue to rise.
Show model answer
Did your answer mention:
Describe three natural factors affecting long-term global climate
Which of the following natural forces is responsible for the release of carbon dioxide and other atmospheric gases?
Two of these four options shift climate without releasing new gases into the atmosphere, and one of the four is a human activity rather than a natural force — the section’s paragraph on this driver names the gases and solids it releases directly.The cyclic changes in Earth’s orbit that may affect climate, recurring on a scale of about 19,000 to 100,000 years, are called the ________.
This factor is named for changes in the planet’s own orbital path, not for anything in the atmosphere itself.The amount of solar power or energy the sun emits in a given amount of time is called ________.
As this quantity rises or falls, Earth’s temperature rises or falls with it — this section proposes it as one explanation for the Little Ice Age.A global cooling phenomenon that occurs when dust, ash, or other particles from a volcanic eruption block out sunlight is called ________.
This phenomenon is named for the atmospheric condition the blocked sunlight produces, and it can last a year or more after an eruption before fading.Compare and contrast how natural- and human-induced processes have influenced global climate change.
Show model answer
Did your answer mention:
List two or more greenhouse gases and describe their role in the greenhouse effect
The warming of Earth due to carbon dioxide and other greenhouse gases in the atmosphere is called the ________.
This process is named by analogy to a garden structure whose glass panes trap heat inside in a similar way.Atmospheric gases such as carbon dioxide and methane that absorb and emit radiation, trapping heat in Earth’s atmosphere, are called ________.
This section names five such gases affecting Earth, including water vapor, nitrous oxide, and ozone alongside the two named in the question.Frozen chunks of ice and methane found at the bottom of the ocean are called ________.
As ocean water warms, these chunks melt and release the methane trapped inside, adding to the atmosphere’s greenhouse gases.This section is adapted from Biology 2e, Section 44.5: Climate and the Effects of Global Climate Change by Mary Ann Clark, Jung Choi, Matthew Douglas, and OpenStax, © OpenStax, licensed under CC BY-NC-SA 4.0. Access the original for free at openstax.org. Changes: figures re-encoded as WebP; three figures re-kinded from the manifest’s file-extension guess — Figure_B44_26 from “diagram” to “photo” (it is a pair of photographs: researchers drilling an ice core and the extracted ice-core sample, not a hand-drawn or computer-rendered image) and Figure_44_05_01 and Figure_44_05_02 from “photo” to “diagram” (both are plotted line graphs, not captured photographs); the source alt of Figure_44_05_01 kept with its “todays” typo corrected to “today’s”; the alts of Figure_44_05_02 and Figure_44_05_04 rewritten from letter-spaced screen-reader spellings (“19 60 to 20 10,” “19 38,” “19 81,” “19 98”) to plain descriptions; the alt of Figure_44_05_03 corrected from the source’s singular “a smokestack” to describe both smokestacks actually visible in the photograph; the alt of Figure_B44_26 rewritten from a terse two-sentence description to a plain description of what each panel shows; longdescs added to the two climate-graph figures (Figure_44_05_01, Figure_44_05_02), transcribing each graph’s axes, its printed tick values, and its plotted trend, and to Figure_44_05_04, transcribing the year and photographer credit printed on each of its four panels; the interactive note rendered as a Link to Learning callout, keeping the module’s own openstax.org/l/climate_plants redirect URL; the end-of-section Review Questions and Critical Thinking Questions adapted into the closing interactive Practice block (multiple choice and self-check respectively); rubric checkpoints added to each self-check, decomposing its model answer (the source solution) into check-off clauses with no new claims; nine key-term recall items added from the glossary (clathrates, climate, global climate change, greenhouse effect, greenhouse gases, haze-effect cooling, Milankovitch cycles, solar intensity, weather), covering all nine of the section’s glossary terms; two local multiple-choice items added to the Industrial Revolution/CO₂ objective’s Practice group, built strictly from the page’s own figure caption and prose sentences, since the module keeps no Review or Critical Thinking item testing that objective specifically; the glossary entry for “solar intensity” corrected from “amount of solar power energy the sun emits” to “amount of solar power or energy the sun emits,” matching the section’s own prose definition of the term — reported as a source defect below. Source defects: module m66419, glossary definition fs-idp133556656 (“solar intensity”) reads “amount of solar power energy the sun emits in a given amount of time,” dropping the “or” that the section’s own prose uses in the sentence “Solar intensity is the amount of solar power or energy the sun emits in a given amount of time” — corrected on the page as noted above. One number is corrected with a visible Source note: atmospheric carbon dioxide in 1950 was about 310 ppm, not the pre-industrial 280 (erratum 455).