Environmental Limits to Population Growth
By the end of this section, you will be able to:
- Explain the characteristics of and differences between exponential and logistic growth patterns
- Give examples of exponential and logistic growth in natural populations
- Describe how natural selection and environmental adaptation led to the evolution of particular life history patterns
Although life histories describe the way many characteristics of a population (such as their age structure) change over time in a general way, population ecologists make use of a variety of methods to model population dynamics mathematically. These more precise models can then be used to accurately describe changes occurring in a population and better predict future changes. Certain long-accepted models are now being modified or even abandoned due to their lack of predictive ability, and scholars strive to create effective new models.
Exponential Growth
Charles Darwin, in his theory of natural selection, was greatly influenced by the English clergyman Thomas Malthus. Malthus published a book in 1798 stating that populations with unlimited natural resources grow very rapidly, which represents an exponential growth, and then population growth decreases as resources become depleted, indicating a logistic growth.
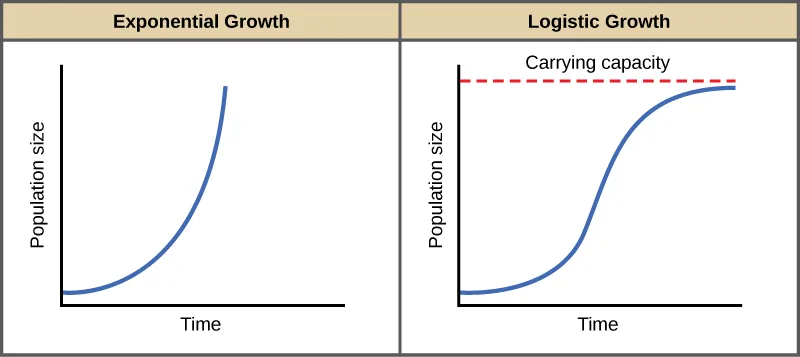
The best example of exponential growth is seen in bacteria. Bacteria reproduce by prokaryotic fission. This division takes about an hour for many bacterial species. If 1000 bacteria are placed in a large flask with an unlimited supply of nutrients (so the nutrients will not become depleted), after an hour, there is one round of division and each organism divides, resulting in 2000 organisms—an increase of 1000. In another hour, each of the 2000 organisms will double, producing 4000, an increase of 2000 organisms. After the third hour, there should be 8000 bacteria in the flask, an increase of 4000 organisms. The important concept of exponential growth is the accelerating population growth rate—the number of organisms added in each reproductive generation—that is, it is increasing at a greater and greater rate. After 1 day and 24 of these cycles, the population would have increased from 1000 to more than 16 billion. When the population size, N, is plotted over time, a J-shaped growth curve is produced, shown below.
The bacteria example is not representative of the real world where resources are limited. Furthermore, some bacteria will die during the experiment and thus not reproduce, lowering the growth rate. Therefore, when calculating the growth rate of a population, the death rate (D) (number organisms that die during a particular time interval) is subtracted from the birth rate (B) (number organisms that are born during that interval). This is shown in the following formula:
The birth rate is usually expressed on a per capita (for each individual) basis. Thus, B (birth rate) = bN (the per capita birth rate “b” multiplied by the number of individuals “N”) and D (death rate) = dN (the per capita death rate “d” multiplied by the number of individuals “N”). Additionally, ecologists are interested in the population at a particular point in time, an infinitely small time interval. For this reason, the terminology of differential calculus is used to obtain the “instantaneous” growth rate, replacing the change in number and time with an instant-specific measurement of number and time.
Notice that the “d” associated with the first term refers to the derivative (as the term is used in calculus) and is different from the death rate, also called “d.” The difference between birth and death rates is further simplified by substituting the term “r” (intrinsic rate of increase signifying the maximum per capita growth rate under ideal conditions) for the relationship between birth and death rates:
The value “r” can be positive, meaning the population is increasing in size; or negative, meaning the population is decreasing in size; or zero, where the population’s size is unchanging, a condition known as zero population growth. A further refinement of the formula recognizes that different species have inherent differences in their intrinsic rate of increase (often thought of as the potential for reproduction), even under ideal conditions. Obviously, a bacterium can reproduce more rapidly and have a higher intrinsic rate of growth than a human. The maximal growth rate for a species is its biotic potential, or rmax, thus changing the equation to:
Extended description
Two side-by-side line graphs share the same unlabeled Population size vertical axis and Time horizontal axis. The left panel, headed Exponential Growth, shows one blue curve that starts low near the origin and curves upward with increasing steepness all the way to the right edge of the plot, producing a J shape that never levels off. The right panel, headed Logistic Growth, adds a horizontal red dashed line labeled Carrying capacity near the top of the plot; its blue curve also starts low near the origin, rises slowly at first, steepens through the middle of the plot, then curves over and flattens out just beneath the dashed line at the right edge, producing an S shape.
Logistic Growth
Exponential growth is possible only when infinite natural resources are available; this is not the case in the real world. Charles Darwin recognized this fact in his description of the “struggle for existence,” which states that individuals will compete (with members of their own or other species) for limited resources. The successful ones will survive to pass on their own characteristics and traits (which we know now are transferred by genes) to the next generation at a greater rate (natural selection). To model the reality of limited resources, population ecologists developed the logistic growth model.
Carrying Capacity and the Logistic Model
In the real world, with its limited resources, exponential growth cannot continue indefinitely. Exponential growth may occur in environments where there are few individuals and plentiful resources, but when the number of individuals gets large enough, resources will be depleted, slowing the growth rate. Eventually, the growth rate will plateau or level off, shown above. This population size, which represents the maximum population size that a particular environment can support, is called the carrying capacity, or K.
The formula we use to calculate logistic growth adds the carrying capacity as a moderating force in the growth rate. The expression “K – N” indicates how many individuals may be added to a population at a given stage, and “K – N” divided by “K” is the fraction of the carrying capacity available for further growth. Thus, the exponential growth model is restricted by this factor to generate the logistic growth equation:
Notice that when N is very small, (K-N)/K becomes close to K/K or 1, and the right side of the equation reduces to rmaxN, which means the population is growing exponentially and is not influenced by carrying capacity. On the other hand, when N is large, (K-N)/K comes close to zero, which means that population growth will be slowed greatly or even stopped. Thus, population growth is greatly slowed in large populations by the carrying capacity K. This model also allows for the population of a negative population growth, or a population decline. This occurs when the number of individuals in the population exceeds the carrying capacity (because the value of (K-N)/K is negative).
A graph of this equation yields an S-shaped curve, shown above, and it is a more realistic model of population growth than exponential growth. There are three different sections to an S-shaped curve. Initially, growth is exponential because there are few individuals and ample resources available. Then, as resources begin to become limited, the growth rate decreases. Finally, growth levels off at the carrying capacity of the environment, with little change in population size over time.
Role of Intraspecific Competition
The logistic model assumes that every individual within a population will have equal access to resources and, thus, an equal chance for survival. For plants, the amount of water, sunlight, nutrients, and the space to grow are the important resources, whereas in animals, important resources include food, water, shelter, nesting space, and mates.
In the real world, phenotypic variation among individuals within a population means that some individuals will be better adapted to their environment than others. The resulting competition between population members of the same species for resources is termed intraspecific competition (intra- = “within”; -specific = “species”). Intraspecific competition for resources may not affect populations that are well below their carrying capacity—resources are plentiful and all individuals can obtain what they need. However, as population size increases, this competition intensifies. In addition, the accumulation of waste products can reduce an environment’s carrying capacity.
Examples of Logistic Growth
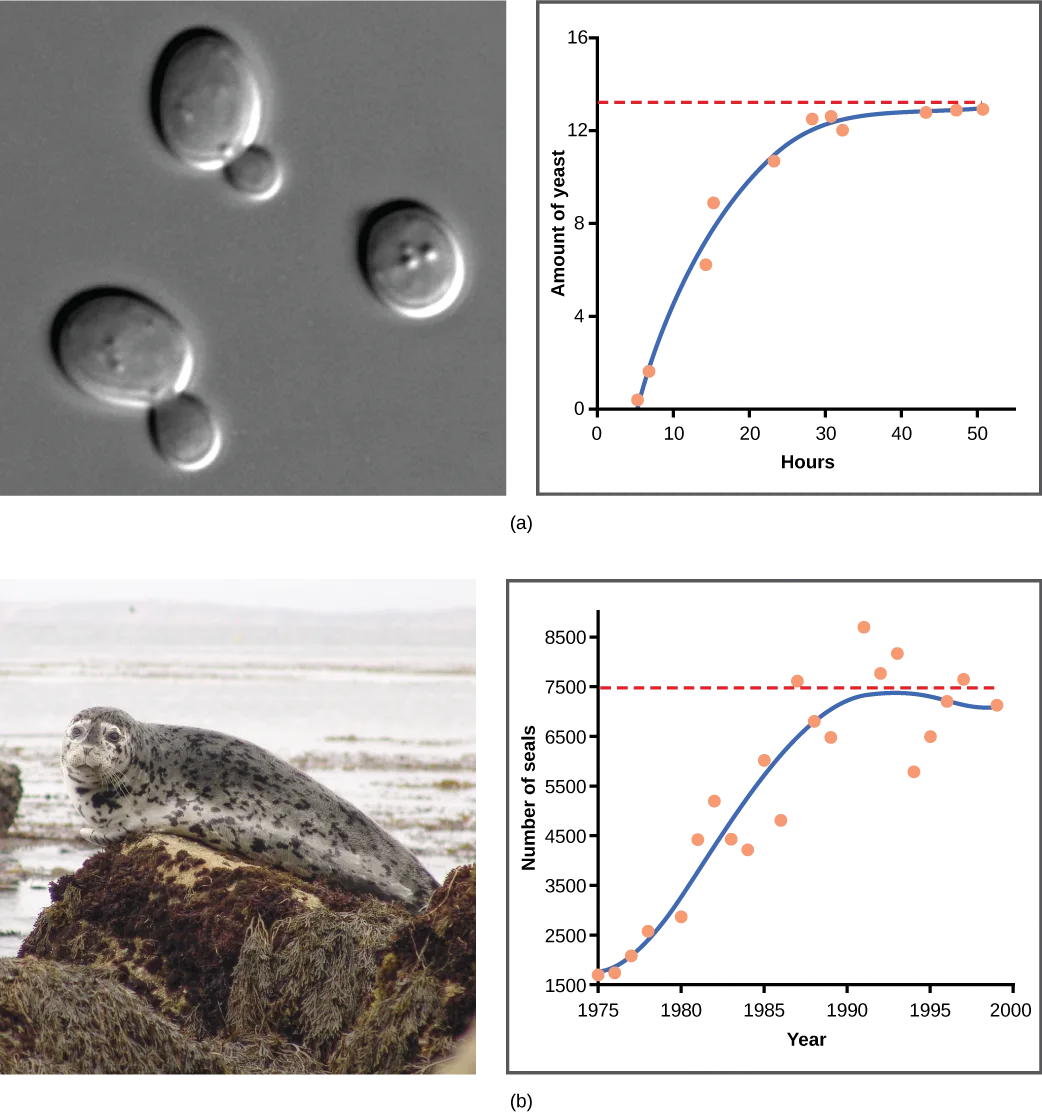
Yeast, a microscopic fungus used to make bread and alcoholic beverages, exhibits the classical S-shaped curve when grown in a test tube, shown below (a). Its growth levels off as the population depletes the nutrients. In the real world, however, there are variations to this idealized curve. Examples in wild populations include sheep and harbor seals, shown below (b). In both examples, the population size exceeds the carrying capacity for short periods of time and then falls below the carrying capacity afterwards. This fluctuation in population size continues to occur as the population oscillates around its carrying capacity. Still, even with this oscillation, the logistic model is confirmed.
Extended description
Panel (a), at top: a black-and-white micrograph at left shows three oval yeast cells, two of them (upper left and lower left) with a smaller round bud attached at the side and the third (right) without one; at right, a graph plots Amount of yeast (vertical axis, 0 to 16) against Hours (horizontal axis, 0 to 50). A red dashed horizontal line runs just above 12 on the vertical axis. Orange data points climb steeply from near 0 around hour 5 through about hour 30, then cluster tightly along the dashed line from about hour 30 to hour 50, and a blue curve fit through the points rises steeply and flattens to meet the dashed line. Panel (b), below: at left, a color photograph shows a spotted harbor seal resting on a rock outcrop with water in the background; at right, a graph plots Number of seals (vertical axis, 1,500 to 8,500) against Year (horizontal axis, 1975 to 2000). A red dashed horizontal line runs at about 7,500. Orange data points rise from about 1,600 in 1975 to a peak near 8,600 around 1991, then scatter both above and below the dashed line through 1999, and a blue curve fit through the points rises steeply through the 1980s, levels off just below the dashed line around 1990–1993, and dips slightly toward 1999 without ever crossing the line.
If the major food source of the seals declines due to pollution or overfishing, which of the following would likely occur?
A falling food supply changes how many individuals the environment can support before it changes anything else — decide which quantity in each option would drop first, then predict what happens to the other quantity in that same option as a result.Summary
Populations with unlimited resources grow exponentially, with an accelerating growth rate. When resources become limiting, populations follow a logistic growth curve. The population of a species will level off at the carrying capacity of its environment.
Key terms
- biotic potential (rmax) — maximal potential growth rate of a species
- birth rate (B) — number of births within a population at a specific point in time
- carrying capacity (K) — number of individuals of a species that can be supported by the limited resources of a habitat
- death rate (D) — number of deaths within a population at a specific point in time
- exponential growth — accelerating growth pattern seen in species under conditions where resources are not limiting
- intraspecific competition — competition between members of the same species
- J-shaped growth curve — shape of an exponential growth curve
- logistic growth — leveling off of exponential growth due to limiting resources
- population growth rate — number of organisms added in each reproductive generation
- S-shaped growth curve — shape of a logistic growth curve
- zero population growth — steady population size where birth rates and death rates are equal
Practice
Explain the characteristics of and differences between exponential and logistic growth patterns
Species with limited resources usually exhibit a(n) ________ growth curve.
One of the four options names the growth pattern that levels off once resources run short — match the shape to the condition described here, not to a word that merely sounds scientific.The maximum rate of increase characteristic of a species is called its ________.
This term names the theoretical ceiling on a species’ own per capita growth rate under ideal conditions, not the population size an environment can support.The population size of a species capable of being supported by the environment is called its ________.
This term names a property of the environment’s resources, not a property of the species’ own reproductive rate.Describe the rate of population growth that would be expected at various parts of the S-shaped curve of logistic growth.
Show model answer
Did your answer mention:
A steady population size where birth rates and death rates are equal is called ________.
This is the condition where the intrinsic rate of increase works out to neither positive nor negative.Give examples of exponential and logistic growth in natural populations
Describe how the population of a species that survives a mass extinction event would change in size and growth pattern over time beginning immediately after the extinction event.
Show model answer
Did your answer mention:
The shape produced when population size is plotted against time under exponential growth is called a(n) ________.
This growth pattern accelerates without ever leveling off, the way the bacteria-in-a-flask example does — picture the shape of the letter it is named for.The shape produced when population size is plotted against time under logistic growth is called a(n) ________.
This curve accelerates like exponential growth at first, then bends over and flattens near the carrying capacity, the way the yeast and seal examples do — picture the shape of the letter it is named for.Describe how natural selection and environmental adaptation led to the evolution of particular life history patterns
How does natural selection connect to intraspecific competition, according to this section?
Show model answer
Did your answer mention:
Competition between members of the same species for resources is called ________.
The prefix here means ‘within’ — this competition happens within one species, not between two different ones.Intraspecific competition for resources is least likely to affect individuals in a population that is ________.
The section says this competition intensifies as population size increases — find the option describing the population farthest from that condition.This section is adapted from Biology 2e, Section 45.3: Environmental Limits to Population Growth by Mary Ann Clark, Jung Choi, Matthew Douglas, and OpenStax, © OpenStax, licensed under CC BY-NC-SA 4.0. Access the original for free at openstax.org. Changes: figures re-encoded as WebP with the source alt text kept as printed; Figure_45_03_01 re-kinded from the manifest’s file-extension “photo” guess to “diagram” (it is a two-panel line-graph illustration, not a captured photograph); a longdesc added to both figures, transcribing each graph’s axes, its carrying-capacity line, and its curve shape/trend in reading order (the yeast/seal Visual Connection figure’s longdesc names only the printed axes and curve trend and never states which of the four listed statements is false); five equations set as display math ($$…$$), the first dropping the source’s inline English glosses ("(change in number)", “(birth rate)”, etc.) that sit inside the MathML alongside the algebra, since those glosses are already carried by the surrounding prose; the module’s own Visual Connection is kept in the body immediately after its figure as a multiple choice, rather than duplicated in Practice — its <exercise> copy (fs-idp14262368) opens with a stray “b” label before “If the major food source” (a leftover cross-reference to Figure 45.10’s panel b that this site does not print); the stray label is dropped, and the note copy and the <exercise> copy are otherwise identical in wording and both key A; the end-of-section Review Questions and Critical Thinking Questions adapted into the closing interactive Practice block (multiple choice and self-check respectively); rubric checkpoints added to each self-check, decomposing its model answer (the source solution) into check-off clauses with no new claims; four key-term recall items added from the glossary (zero population growth, J-shaped growth curve, S-shaped growth curve, intraspecific competition), covering four of the section’s eleven glossary terms — the rest appear only in the Key terms list and the prose, several as the bolded defining term of their own paragraph; the third objective (“Describe how natural selection and environmental adaptation led to the evolution of particular life history patterns”) is only lightly covered by this module’s own prose (a single mention of Darwin’s “struggle for existence” and natural selection, plus the Intraspecific Competition subsection), so its Practice group adds one self-check and one multiple choice built strictly from those two passages, with no claim beyond what the section states; Review Question fs-idm266378560’s prompt corrected from the source’s “The maximum rate of increased characteristic of a species is called its ________” to “The maximum rate of increase characteristic of a species is called its ________” — a prose typo, reported as a source defect below. Source defects: module m66690, equation eip-622 (the logistic growth equation) — the raw CNXML and the printed PDF both set it as dN/dT = rmax dN/dT = rmaxN(K − N)/K, with an extra “= rmax dN/dT” step between the left-hand side and the final expression that does not hold mathematically (it would force rmax = 1) and is not supported by the surrounding prose, which describes only two terms — “the right side of the equation reduces to rmaxN” when N is small, referring to the equation dN/dT = rmaxN(K − N)/K; the local page sets the equation without that extra step; module m66690, exercise fs-idm266378560 — its printed prompt reads “The maximum rate of increased characteristic of a species is called its ________,” which is ungrammatical; corrected to “increase” above.