Human Population Growth
By the end of this section, you will be able to:
- Discuss exponential human population growth
- Explain how humans have expanded the carrying capacity of their habitat
- Relate population growth and age structure to the level of economic development in different countries
- Discuss the long-term implications of unchecked human population growth
Population dynamics can be applied to human population growth. Earth’s human population is growing rapidly, to the extent that some worry about the ability of the earth’s environment to sustain this population. Long-term exponential growth carries the potential risks of famine, disease, and large-scale death.
Although humans have increased the carrying capacity of their environment, the technologies used to achieve this transformation have caused unprecedented changes to Earth’s environment, altering ecosystems to the point where some may be in danger of collapse. The depletion of the ozone layer, erosion due to acid rain, and damage from global climate change are caused by human activities. The ultimate effect of these changes on our carrying capacity is unknown. As some point out, it is likely that the negative effects of increasing carrying capacity will outweigh the positive ones—the world’s carrying capacity for human beings might actually decrease.
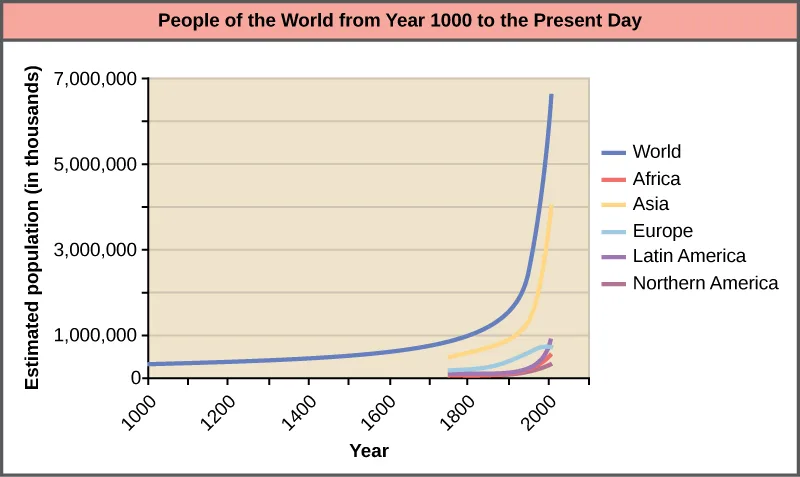
The human population is currently experiencing exponential growth even though human reproduction is far below its biotic potential (shown below). To reach its biotic potential, all females would have to become pregnant every nine months or so during their reproductive years. Also, resources would have to be such that the environment would support such growth. Neither of these two conditions exists. In spite of this fact, human population is still growing exponentially.
Extended description
The x-axis runs from 1000 to a little past 2000, labeled at 1000, 1200, 1400, 1600, 1800, and 2000; the y-axis, labeled ‘Estimated population (in thousands),’ runs from 0 to 7,000,000. Six curves are plotted, listed top to bottom in the legend: World (dark blue), Africa (red), Asia (yellow), Europe (light blue), Latin America (purple), and Northern America (maroon). All six curves stay low and nearly flat from 1000 until about 1800, then bend upward; the World curve rises steepest, reaching about 6,800,000 thousand by 2000. The Asia curve climbs to about 4,000,000 thousand by 2000, well above the other four regional curves, which stay under roughly 1,000,000 thousand. The Europe curve flattens out again near the end of the graph while the other curves are still climbing.
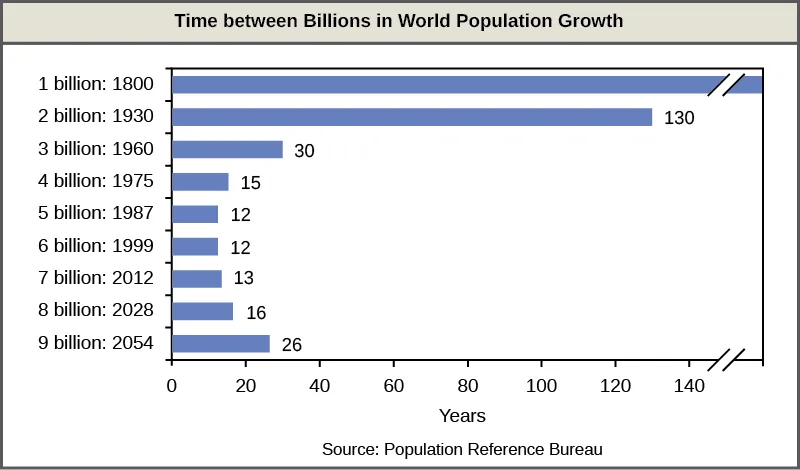
A consequence of exponential human population growth is a reduction in time that it takes to add a particular number of humans to the Earth. The bar graph below shows that 123 years were necessary to add 1 billion humans in 1930, but it only took 24 years to add two billion people between 1975 and 1999. As already discussed, our ability to increase our carrying capacity indefinitely may be limited. Without new technological advances, the human growth rate has been predicted to slow in the coming decades. However, the population will still be increasing and the threat of overpopulation remains.
Extended description
Nine horizontal bars are stacked top to bottom, each labeled at left with a population milestone and year: ‘1 billion: 1800,’ ‘2 billion: 1930,’ ‘3 billion: 1960,’ ‘4 billion: 1975,’ ‘5 billion: 1987,’ ‘6 billion: 1999,’ ‘7 billion: 2012,’ ‘8 billion: 2028,’ and ‘9 billion: 2054.’ The x-axis, labeled ‘Years,’ runs from 0 to about 140, with a diagonal break mark near its end. The first bar (‘1 billion: 1800’) is the longest and carries no year-count number. The second bar (‘2 billion: 1930’) is almost as long and is labeled 130. The remaining seven bars shorten sharply and are each labeled with their own year count: 30 (3 billion, 1960), 15 (4 billion, 1975), 12 (5 billion, 1987), 12 (6 billion, 1999), 13 (7 billion, 2012), 16 (8 billion, 2028), and 26 (9 billion, 2054).
Link to Learning
Click through this video of how human populations have changed over time.
Overcoming Density-Dependent Regulation
Humans are unique in their ability to alter their environment with the conscious purpose of increasing carrying capacity. This ability is a major factor responsible for human population growth and a way of overcoming density-dependent growth regulation. Much of this ability is related to human intelligence, society, and communication. Humans can construct shelter to protect them from the elements and have developed agriculture and domesticated animals to increase their food supplies. In addition, humans use language to communicate this technology to new generations, allowing them to improve upon previous accomplishments.
Other factors in human population growth are migration and public health. Humans originated in Africa, but have since migrated to nearly all inhabitable land on the Earth. Public health, sanitation, and the use of antibiotics and vaccines have decreased the ability of infectious disease to limit human population growth. In the past, diseases such as the bubonic plague of the fourteenth century killed between 30 and 60 percent of Europe’s population and reduced the overall world population by as many as 100 million people. Today, the threat of infectious disease, while not gone, is certainly less severe. According to the Institute for Health Metrics and Evaluation (IHME) in Seattle, global death from infectious disease declined from 15.4 million in 1990 to 10.4 million in 2017. To compare to some of the epidemics of the past, the percentage of the world’s population killed between 1993 and 2002 decreased from 0.30 percent of the world’s population to 0.14 percent. Thus, infectious disease influence on human population growth is becoming less significant.
Age Structure, Population Growth, and Economic Development
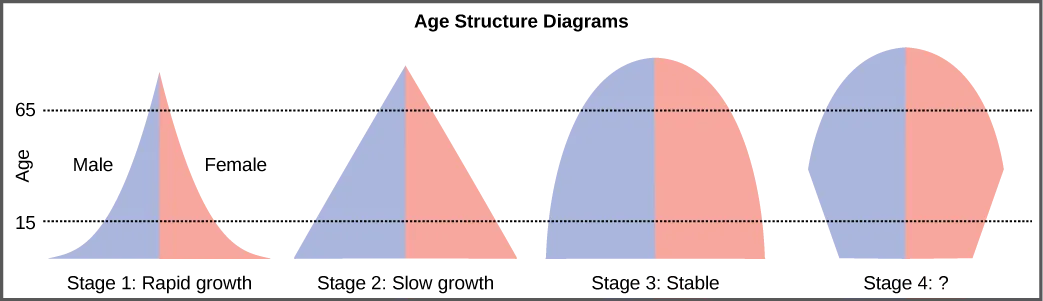
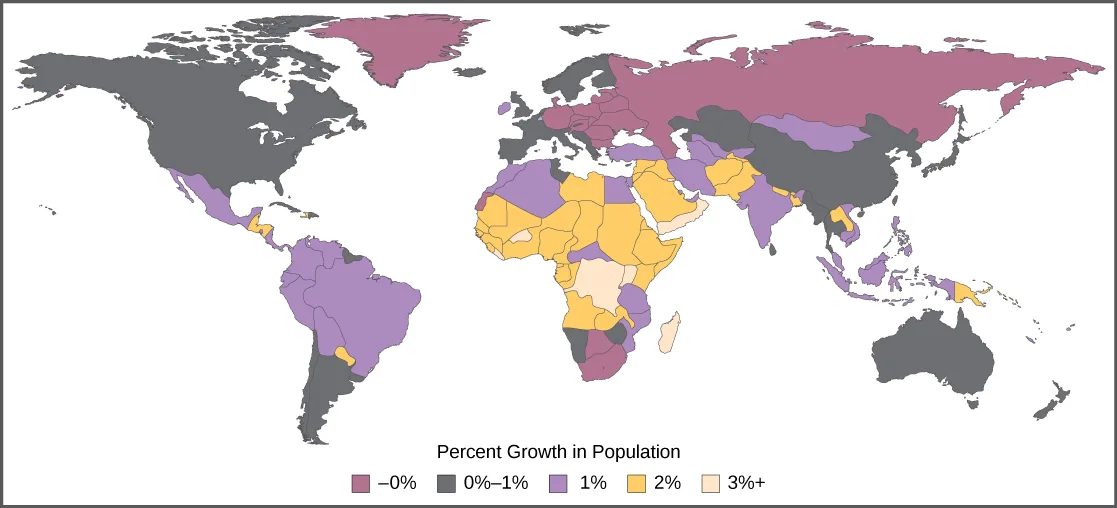
The age structure of a population is an important factor in population dynamics. Age structure is the proportion of a population at different age ranges. Age structure allows better prediction of population growth, plus the ability to associate this growth with the level of economic development in the region. Countries with rapid growth have a pyramidal shape in their age structure diagrams, showing a preponderance of younger individuals, many of whom are of reproductive age or will be soon (shown below). This pattern is most often observed in underdeveloped countries where individuals do not live to old age because of less-than-optimal living conditions. Age structures of areas with slow growth, including developed countries such as the United States, still have a pyramidal structure, but with many fewer young and reproductive-aged individuals and a greater proportion of older individuals. Other developed countries, such as Italy, have zero population growth. The age structure of these populations is more conical, with an even greater percentage of middle-aged and older individuals. The actual growth rates in different countries are shown in the map below, with the highest rates tending to be in the less economically developed countries of Africa and Asia.
Extended description
Four bell- or pyramid-shaped outlines are shown side by side under the title ‘Age Structure Diagrams,’ each split down the middle into a blue left half labeled ‘Male’ and a pink right half labeled ‘Female’ (the Male/Female labels are printed only on the first panel). A shared y-axis at the far left, labeled ‘Age,’ carries two dotted horizontal gridlines at 15 and 65. Panel 1, ‘Stage 1: Rapid growth,’ is wide at the base and narrows rapidly to a sharp point near the top, so most of the shape’s area sits below the 15 line. Panel 2, ‘Stage 2: Slow growth,’ is a straight-sided triangle that narrows steadily from base to a point at the top. Panel 3, ‘Stage 3: Stable,’ has straight lower sides that curve inward and round off at the top, wider through the middle than panel 2. Panel 4, ‘Stage 4: ?,’ starts narrower than panel 3 at the base, widens to about panel 3’s base width by the middle of the shape, then narrows to a rounded top; its outline bulges outward around the middle instead of tapering steadily like the first two panels.
Age structure diagrams for rapidly growing, slow growing, and stable populations are shown in stages 1 through 3. What type of population change do you think stage 4 represents?
Show model answer
Did your answer mention:
Extended description
A world map is shaded by a five-band legend, ‘Percent Growth in Population,’ reading left to right: −0% (dark red), 0%–1% (gray), 1% (purple), 2% (yellow), and 3%+ (pale cream). Eastern Europe, Northern Asia, Greenland, and South Africa are shaded −0%. The United States, Canada, the southern part of South America, China, Japan, western Europe, and Australia are shaded 0%–1%. Mexico, the northern part of South America, and parts of Africa, the Middle East, and Asia are shaded 1%. Most of Africa and parts of the Middle East and Asia are shaded 2%. A few parts of Africa are shaded 3%+.
Long-Term Consequences of Exponential Human Population Growth
Many dire predictions have been made about the world’s population leading to a major crisis called the “population explosion.” In the 1968 book The Population Bomb, biologist Dr. Paul R. Ehrlich wrote, “The battle to feed all of humanity is over. In the 1970s hundreds of millions of people will starve to death in spite of any crash programs embarked upon now. At this late date nothing can prevent a substantial increase in the world death rate.” (Paul R. Ehrlich, prologue to The Population Bomb, 1968; repr., New York: Ballantine, 1970.) While many experts view this statement as incorrect based on evidence, the laws of exponential population growth are still in effect, and unchecked human population growth cannot continue indefinitely.
Several nations have instituted policies aimed at influencing population. Efforts to control population growth led to the one-child policy in China, which is now being phased out. India also implements national and regional policies to encourage family planning. On the other hand, Japan, Spain, Russia, Iran, and other countries have made efforts to increase population growth after birth rates dipped. Such policies are controversial, and the human population continues to grow. At some point the food supply may run out, but the outcomes are difficult to predict. The United Nations estimates that future world population growth may vary from 6 billion (a decrease) to 16 billion people by the year 2100.
Another result of population growth is the endangerment of the natural environment. Many countries have attempted to reduce the human impact on climate change by reducing their emission of the greenhouse gas carbon dioxide. However, these treaties have not been ratified by every country. The role of human activity in causing climate change has become a hotly debated socio-political issue in some countries, including the United States. Thus, we enter the future with considerable uncertainty about our ability to curb human population growth and protect our environment.
Link to Learning
Watch this data visualization and watch the human population growth over time.
Summary
The world’s human population is growing at an exponential rate. Humans have increased the world’s carrying capacity through migration, agriculture, medical advances, and communication. The age structure of a population allows us to predict population growth. Unchecked human population growth could have dire long-term effects on our environment.
Key terms
- age structure — proportion of population members at specific age ranges
- one-child policy — China’s policy to limit population growth by limiting urban couples to have only one child or face the penalty of a fine
Practice
Discuss exponential human population growth
The world’s human population is growing at a(n) ________ rate.
The section’s opening paragraphs name this growth pattern more than once — it describes a rate that keeps accelerating rather than staying level.According to the section, exponential human population growth has caused the time it takes to add each additional billion people to the Earth to ________.
Think about what happens to the length of each interval as the population keeps growing exponentially — does adding the next billion people take more time or less?Why is the human population still growing exponentially even though human reproduction is far below its biotic potential?
Show model answer
Did your answer mention:
Explain how humans have expanded the carrying capacity of their habitat
Which of the following is not a way that humans have increased the carrying capacity of the environment?
Three of the four options are things the section credits with expanding what the environment can support, whether through technology passed to new generations, domesticated food sources, or farming methods; the remaining option describes consuming resources rather than expanding the environment’s capacity to support them.Humans have increased the world’s carrying capacity through migration, agriculture, medical advances, and ________.
The section’s first subsection says humans use this to pass technology on to new generations, letting each generation improve on the last.How have migration and public health affected human population growth, according to the section?
Show model answer
Did your answer mention:
Relate population growth and age structure to the level of economic development in different countries
A country with zero population growth is likely to be ________.
The section names one specific European country that has reached zero population growth, and says which broad category of countries it belongs to.Which type of country has the greatest proportion of young individuals?
The section says which category of countries has a pyramidal age structure with many individuals who are of reproductive age or younger.Describe the age structures in rapidly growing countries, slowly growing countries, and countries with zero population growth.
Show model answer
Did your answer mention:
The proportion of a population at different age ranges is called its ________.
The section defines this in bold right where it introduces how population growth relates to a country’s level of economic development.Discuss the long-term implications of unchecked human population growth
Since the introduction of the Endangered Species Act the number of species on the protected list has more than doubled. Describe how the human population’s growth pattern contributes to the rise in endangered species.
Show model answer
Did your answer mention:
China’s policy to limit population growth by limiting urban couples to have only one child or face a fine is called the ________.
The section discusses this policy in the paragraph about nations that have instituted policies aimed at influencing population, right before naming India’s family-planning policies.Unchecked human population growth could have dire ________ on our environment.
The section’s closing summary sentence pairs this phrase with ‘dire’ — think about the timescale it describes, not the severity.This section is adapted from Biology 2e, Section 45.5: Human Population Growth by Mary Ann Clark, Jung Choi, Matthew Douglas, and OpenStax, © OpenStax, licensed under CC BY-NC-SA 4.0. Access the original for free at openstax.org. Changes: all four figures re-encoded as WebP and re-kinded from the manifest’s file-extension guess of “photo” to “diagram” (Figure_45_05_01, Figure_45_05_02, and Figure_45_05_04 are a line graph, a bar graph, and a shaded world map, none of them a captured photograph; Figure_45_05_03 the manifest already guessed correctly); the source alt text for all four figures was rewritten (the source alts run 556–947 characters, three of the four over the 600-character lint cap, and read as inline data transcriptions rather than accessible descriptions) into a short alt naming what is drawn, with a longdesc added to each carrying the counted, labeled walk-through the source alt held — the six-curve legend and axis scale for Figure_45_05_01, the nine bar labels and year counts for Figure_45_05_02, the four panels’ shapes and shared Age axis for Figure_45_05_03 (transcribing the printed “Stage 4: ?” label without stating which population trend it represents, since that is the visual connection’s own question), and the five-band legend and shaded regions for Figure_45_05_04; the body Visual Connection (exercise fs-idm238521552, keyed prose) rendered as its figure followed by a self-check, keeping the note’s own “stages 1 through 3 are shown” preamble in the question, with its rubric checkpoints transcribing only the two-clause source solution; four in-text figure cross-references (“Figure 45.14” style pointers, printed via unlabelled cross-reference links in the source) replaced with “shown below,” “the bar graph below,” or “the map below,” since Hugo does not number figures; two Link to Learning notes rendered as callouts, keeping the module’s own openstax.org/l/human_growth and openstax.org/l/populations redirect URLs; two source misspellings corrected on the page — “bubonic plaque” corrected to “bubonic plague” in the Overcoming Density-Dependent Regulation subsection, and the footnote citation’s “Paul R. Erlich” corrected to “Paul R. Ehrlich” to match the section’s own correct spelling of the same name three sentences earlier — both reported as source defects below; the closing footnote citation kept as a parenthetical after the quotation it supports rather than dropped; the end-of-section Review Questions and Critical Thinking Questions adapted into the closing interactive Practice block (multiple choice and self-check respectively); two key-term recall items added from the glossary (age structure, one-child policy — both of the section’s glossary terms); three cloze text-recall items added from the section’s own Summary sentences (exponential, communication, long-term effects); one multiple-choice item and two self-check items in the Practice block are locally written from the section’s own sentences on biotic potential, migration/public health, and the pace of adding each billion people, disclosed here because the Discuss exponential human population growth and Explain how humans have expanded the carrying capacity of their habitat groups had at most one keyed source exercise each; exercise fs-idm142904224 (“A country with zero population growth is likely to be ________”) is keyed C, economically developed, rather than the module’s own printed answer key of D, economically underdeveloped, because the module’s own text contradicts D — reported as a source defect below. Source defects: module m66696, exercise fs-idm142904224 — the module’s printed solution keys D, “economically underdeveloped,” but the module’s own text says “Other developed countries, such as Italy, have zero population growth” and separately says the highest population growth rates tend to be “in the less economically developed countries of Africa and Asia,” so a country with zero population growth is one the module itself calls developed, not underdeveloped; keyed C above. Module m66696, paragraph fs-idm171579728 — prints “the bubonic plaque of the fourteenth century,” which should read “bubonic plague” (the infectious disease, not dental plaque); corrected on the page. Module m66696, footnote fs-idm181607600 — prints the cited author’s name as “Paul R. Erlich,” missing the second “h” that appears in the correct spelling “Ehrlich” used three sentences earlier in the same paragraph to name the same person (biologist Dr. Paul R. Ehrlich, author of The Population Bomb); corrected on the page.