Ecology of Ecosystems
By the end of this section, you will be able to:
- Describe the basic ecosystem types
- Explain the methods that ecologists use to study ecosystem structure and dynamics
- Identify the different methods of ecosystem modeling
- Differentiate between food chains and food webs and recognize the importance of each
Life in an ecosystem is often about competition for limited resources, a characteristic of the theory of natural selection. Competition in communities (all living things within specific habitats) is observed both within species and among different species. The resources for which organisms compete include organic material, sunlight, and mineral nutrients, which provide the energy for living processes and the matter to make up organisms’ physical structures. Other critical factors influencing community dynamics are the components of its physical and geographic environment: a habitat’s latitude, amount of rainfall, topography (elevation), and available species. These are all important environmental variables that determine which organisms can exist within a particular area.
An ecosystem is a community of living organisms and their interactions with their abiotic (nonliving) environment. Ecosystems can be small, such as the tide pools found near the rocky shores of many oceans, or large, such as the Amazon Rainforest in Brazil.
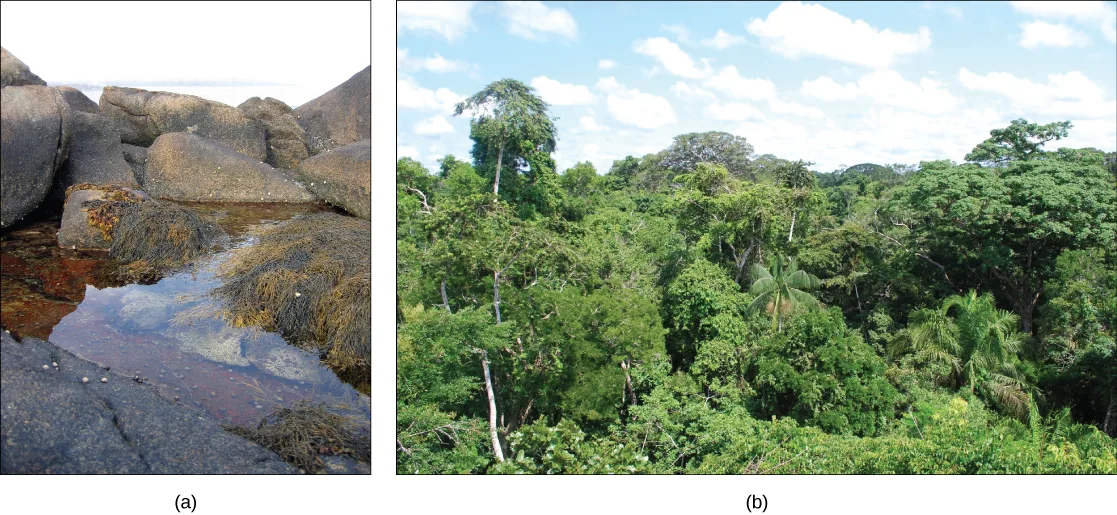
There are three broad categories of ecosystems based on their general environment: freshwater, ocean water, and terrestrial. Within these broad categories are individual ecosystem types based on the organisms present and the type of environmental habitat.
Ocean ecosystems are the most common, comprising over 70 percent of the Earth’s surface and consisting of three basic types: shallow ocean, deep ocean water, and deep ocean surfaces (the low depth areas of the deep oceans). The shallow ocean ecosystems include extremely biodiverse coral reef ecosystems, and the deep ocean surface is known for its large numbers of plankton and krill (small crustaceans) that support it. These two environments are especially important to aerobic respirators worldwide as the phytoplankton perform 40 percent of all photosynthesis on Earth. Although not as diverse as the other two, deep ocean ecosystems contain a wide variety of marine organisms. Such ecosystems exist even at the bottom of the ocean where light is unable to penetrate through the water.
Freshwater ecosystems are the rarest, occurring on only 1.8 percent of the Earth’s surface. Lakes, rivers, streams, and springs comprise these systems. They are quite diverse, and they support a variety of fish, amphibians, reptiles, insects, phytoplankton, fungi, and bacteria.
Terrestrial ecosystems, also known for their diversity, are grouped into large categories called biomes, such as tropical rain forests, savannas, deserts, coniferous forests, deciduous forests, and tundra. Grouping these ecosystems into just a few biome categories obscures the great diversity of the individual ecosystems within them. For example, there is great variation in desert vegetation: the saguaro cacti and other plant life in the Sonoran Desert, in the United States, are relatively abundant compared to the desolate rocky desert of Boa Vista, an island off the coast of Western Africa.
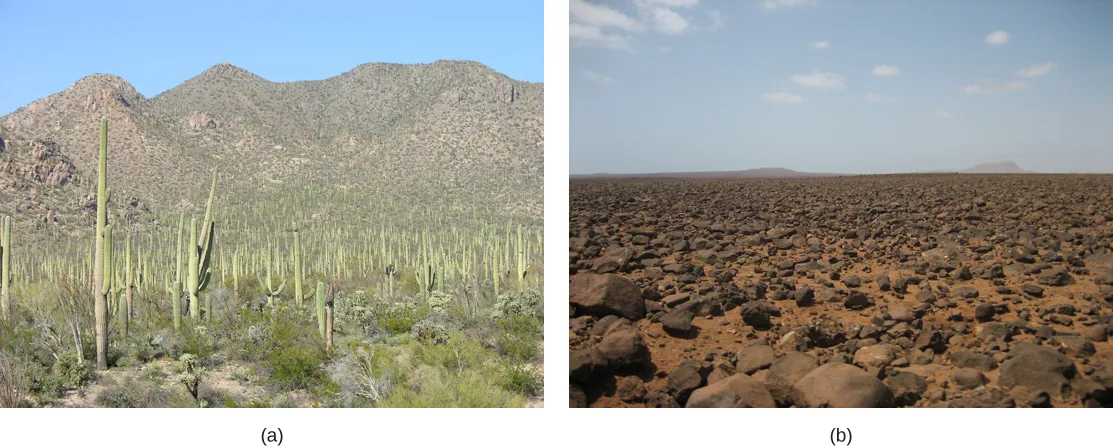
Ecosystems are complex with many interacting parts. They are routinely exposed to various disturbances, or changes in the environment that effect their compositions: yearly variations in rainfall and temperature and the slower processes of plant growth, which may take several years. Many of these disturbances result from natural processes. For example, when lightning causes a forest fire and destroys part of a forest ecosystem, the ground is eventually populated by grasses, then by bushes and shrubs, and later by mature trees, restoring the forest to its former state. The impact of environmental disturbances caused by human activities is as important as the changes wrought by natural processes. Human agricultural practices, air pollution, acid rain, global deforestation, overfishing, eutrophication, oil spills, and waste dumping on land and into the ocean are all issues of concern to conservationists.
Equilibrium is the steady state of an ecosystem where all organisms are in balance with their environment and with each other. In ecology, two parameters are used to measure changes in ecosystems: resistance and resilience. Resistance is the ability of an ecosystem to remain at equilibrium in spite of disturbances. Resilience is the speed at which an ecosystem recovers equilibrium after being disturbed. Ecosystem resistance and resilience are especially important when considering human impact. The nature of an ecosystem may change to such a degree that it can lose its resilience entirely. This process can lead to the complete destruction or irreversible altering of the ecosystem.
Food Chains and Food Webs
The term “food chain” is sometimes used metaphorically to describe human social situations. Individuals who are considered successful are seen as being at the top of the food chain, consuming all others for their benefit, whereas the less successful are seen as being at the bottom.
The scientific understanding of a food chain is more precise than in its everyday usage. In ecology, a food chain is a linear sequence of organisms through which nutrients and energy pass: primary producers, primary consumers, and higher-level consumers are used to describe ecosystem structure and dynamics. There is a single path through the chain. Each organism in a food chain occupies what is called a trophic level. Depending on their role as producers or consumers, species or groups of species can be assigned to various trophic levels.
In many ecosystems, the bottom of the food chain consists of photosynthetic organisms (plants and/or phytoplankton), which are called primary producers. The organisms that consume the primary producers are herbivores: the primary consumers. Secondary consumers are usually carnivores that eat the primary consumers. Tertiary consumers are carnivores that eat other carnivores. Higher-level consumers feed on the next lower trophic levels, and so on, up to the organisms at the top of the food chain: the apex consumers. In the Lake Ontario food chain shown below, the Chinook salmon is the apex consumer at the top of this food chain.
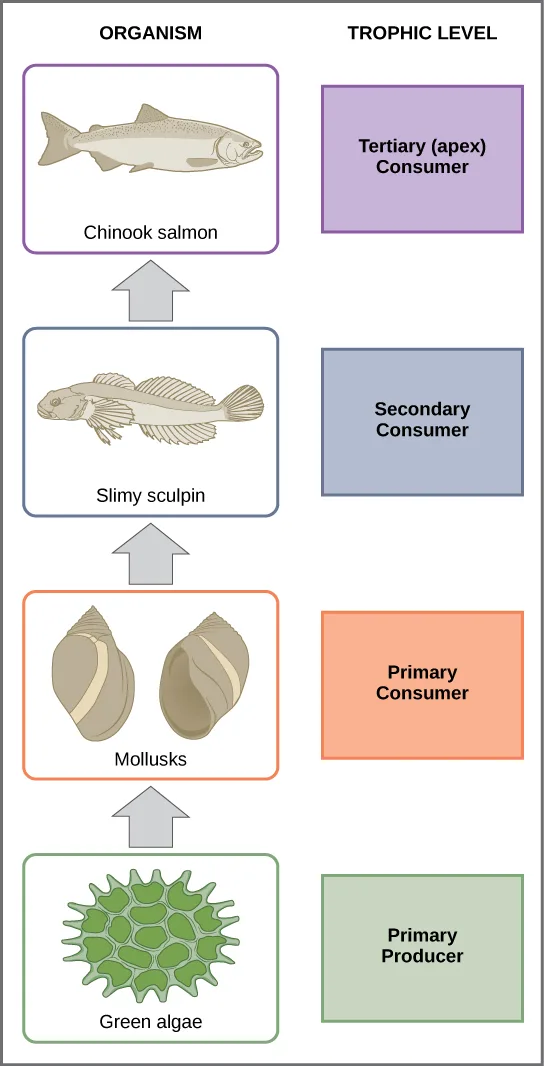
Extended description
Reading bottom to top, with a gray arrow pointing from each organism up to the one that eats it: green algae sits at the bottom beside a green Primary Producer box; above it, two mollusks (snails) sit beside an orange Primary Consumer box; above that, the slimy sculpin, a small fish, sits beside a blue Secondary Consumer box; and at the top, the Chinook salmon sits beside a purple Tertiary (apex) Consumer box.
One major factor that limits the length of food chains is energy. Energy is lost as heat between each trophic level due to the second law of thermodynamics. Thus, after a limited number of trophic energy transfers, the amount of energy remaining in the food chain may not be great enough to support viable populations at yet a higher trophic level.
The loss of energy between trophic levels is illustrated by the pioneering studies of Howard T. Odum in the Silver Springs, Florida, ecosystem in the 1950s. (Source note: the source says the 1940s; the study the module cites (Odum, Ecological Monographs 27 [1957]: 55) was carried out in the early 1950s.) The primary producers generated 20,819 kcal/m²/yr (kilocalories per square meter per year), the primary consumers generated 3,368 kcal/m²/yr, the secondary consumers generated 383 kcal/m²/yr, and the tertiary consumers only generated 21 kcal/m²/yr. Thus, there is little energy remaining for another level of consumers in this ecosystem.
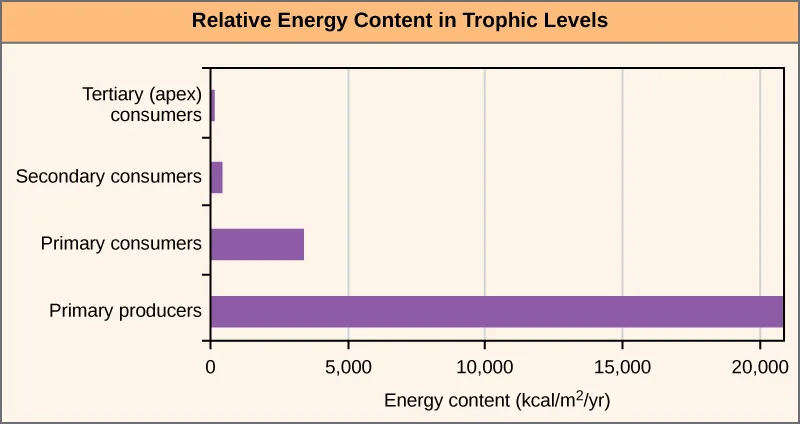
Extended description
The vertical axis lists, bottom to top: Primary producers, Primary consumers, Secondary consumers, Tertiary (apex) consumers. The horizontal axis, Energy content (kcal/m²/yr), is gridlined at 0, 5,000, 10,000, 15,000, and 20,000. The Primary producers bar is by far the longest, extending just past the 20,000 gridline; the Primary consumers bar is much shorter, reaching a little past 3,000; the Secondary consumers bar is a short sliver near 400; and the Tertiary (apex) consumers bar is barely visible, near 20.
There is one problem when using food chains to accurately describe most ecosystems. Even when all organisms are grouped into appropriate trophic levels, some of these organisms can feed on species from more than one trophic level; likewise, some of these organisms can be eaten by species from multiple trophic levels. In other words, the linear model of ecosystems, the food chain, is not completely descriptive of ecosystem structure. A holistic model—which accounts for all the interactions between different species and their complex interconnected relationships with each other and with the environment—is a more accurate and descriptive model for ecosystems. A food web is a graphic representation of a holistic, nonlinear web of primary producers, primary consumers, and higher-level consumers used to describe ecosystem structure and dynamics.
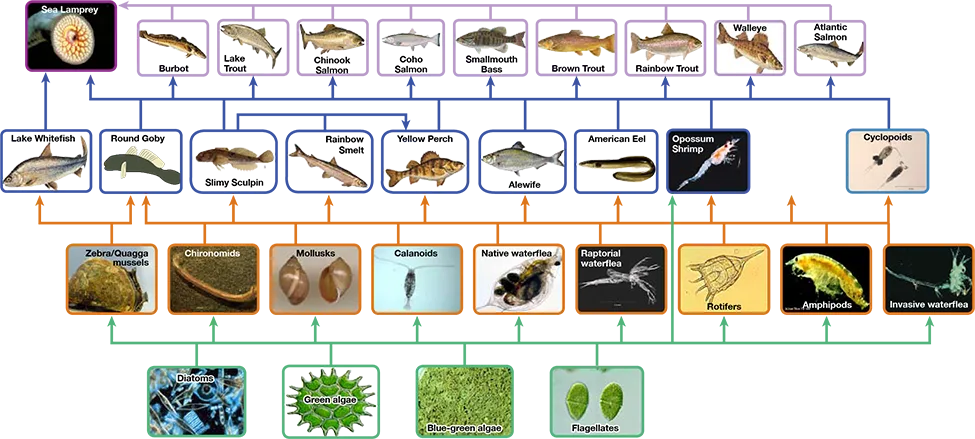
Extended description
Reading bottom to top. Bottom row, outlined green (primary producers), four boxes: Diatoms, Green algae, Blue-green algae, Flagellates. Second row, outlined orange (primary consumers), nine boxes: Zebra/Quagga mussels, Chironomids, Mollusks, Calanoids, Native waterflea, Raptorial waterflea, Rotifers, Amphipods, Invasive waterflea. Third row, outlined blue (secondary consumers), nine boxes: Lake Whitefish, Round Goby, Slimy Sculpin, Rainbow Smelt, Yellow Perch, Alewife, American Eel, Opossum Shrimp, Cyclopoids. Top row, outlined purple (tertiary/apex consumers), ten boxes: Sea Lamprey at the upper left, then Burbot, Lake Trout, Chinook Salmon, Coho Salmon, Smallmouth Bass, Brown Trout, Rainbow Trout, Walleye, Atlantic Salmon. Green arrows generally run from every primary producer box up to every primary consumer box, orange arrows from every primary consumer up to every secondary consumer, and blue arrows from every secondary consumer up to every tertiary/apex consumer, with six exceptions: Lake Whitefish eats only Zebra/Quagga mussels; Round Goby eats every primary consumer; every other secondary consumer eats every primary consumer except Zebra/Quagga mussels; Yellow Perch also eats two of its own row, Slimy Sculpin and Rainbow Smelt; Opossum Shrimp eats the primary consumers in the row below it and also reaches down two rows to eat all four primary producers; and Sea Lamprey, at the top, eats every tertiary and secondary consumer.
A comparison of the two types of structural ecosystem models shows strength in both. Food chains are more flexible for analytical modeling, are easier to follow, and are easier to experiment with, whereas food web models more accurately represent ecosystem structure and dynamics, and data can be directly used as input for simulation modeling.
Two general types of food webs are often shown interacting within a single ecosystem. A grazing food web (such as the Lake Ontario food web above) has plants or other photosynthetic organisms at its base, followed by herbivores and various carnivores. A detrital food web consists of a base of organisms that feed on decaying organic matter (dead organisms), called decomposers or detritivores. These organisms are usually bacteria or fungi that recycle organic material back into the biotic part of the ecosystem as they themselves are consumed by other organisms. As all ecosystems require a method to recycle material from dead organisms, most grazing food webs have an associated detrital food web. For example, in a meadow ecosystem, plants may support a grazing food web of different organisms, primary and other levels of consumers, while at the same time supporting a detrital food web of bacteria, fungi, and detrivorous invertebrates feeding off dead plants and animals.
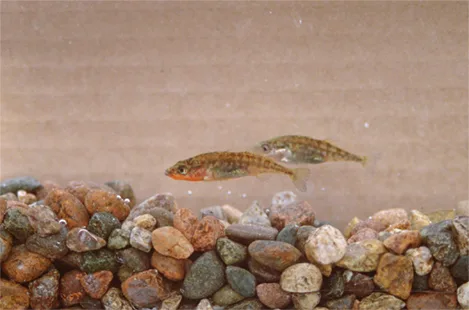
Evolution Connection. Three-spined Stickleback.
It is well established by the theory of natural selection that changes in the environment play a major role in the evolution of species within an ecosystem. However, little is known about how the evolution of species within an ecosystem can alter the ecosystem environment. In 2009, Dr. Luke Harmon, from the University of Idaho, published a paper that for the first time showed that the evolution of organisms into subspecies can have direct effects on their ecosystem environment (Nature, Vol. 458, April 1, 2009).
The three-spined stickleback (Gasterosteus aculeatus) is a freshwater fish that evolved from a saltwater fish to live in freshwater lakes about 10,000 years ago, which is considered a recent development in evolutionary time. Over the last 10,000 years, these freshwater fish then became isolated from each other in different lakes. Depending on which lake population was studied, findings showed that these sticklebacks then either remained as one species or evolved into two species. The divergence of species was made possible by their use of different areas of the pond for feeding called micro niches.
Dr. Harmon and his team created artificial pond microcosms in 250-gallon tanks and added muck from freshwater ponds as a source of zooplankton and other invertebrates to sustain the fish. In different experimental tanks they introduced one species of stickleback from either a single-species or double-species lake.
Over time, the team observed that some of the tanks bloomed with algae while others did not. This puzzled the scientists, and they decided to measure the water’s dissolved organic carbon (DOC), which consists of mostly large molecules of decaying organic matter that give pond-water its slightly brownish color. It turned out that the water from the tanks with two-species fish contained larger particles of DOC (and hence darker water) than water with single-species fish. This increase in DOC blocked the sunlight and prevented algal blooming. Conversely, the water from the single-species tank contained smaller DOC particles, allowing more sunlight penetration to fuel the algal blooms.
This change in the environment, which is due to the different feeding habits of the stickleback species in each lake type, probably has a great impact on the survival of other species in these ecosystems, especially other photosynthetic organisms. Thus, the study shows that, at least in these ecosystems, the environment and the evolution of populations have reciprocal effects that may now be factored into simulation models.
Research into Ecosystem Dynamics: Ecosystem Experimentation and Modeling
The study of the changes in structure of a natural system, caused by changes in the environment (disturbances) or by internal forces, is called ecosystem dynamics. Ecosystems are characterized using a variety of research methodologies. Some ecologists study ecosystems using controlled experimental systems, while some study entire ecosystems in their natural state, and others use both approaches.
A holistic ecosystem model attempts to quantify the composition, interaction, and dynamics of entire ecosystems; it is the most representative of the ecosystem in its natural state. A food web is an example of a holistic ecosystem model. However, this type of study is limited by time and expense, as well as the fact that it is neither feasible nor ethical to do experiments on large natural ecosystems. It is difficult to quantify all different species in an ecosystem and the dynamics in their habitat, especially when studying large habitats such as the Amazon Rainforest.
For these reasons, scientists study ecosystems under more controlled conditions. Experimental systems usually involve either partitioning a part of a natural ecosystem that can be used for experiments, termed a mesocosm, or by recreating an ecosystem entirely in an indoor or outdoor laboratory environment, which is referred to as a microcosm. A major limitation to these approaches is that removing individual organisms from their natural ecosystem or altering a natural ecosystem through partitioning may change the dynamics of the ecosystem. These changes are often due to differences in species numbers and diversity and also to environment alterations caused by partitioning (mesocosm) or recreating (microcosm) the natural habitat. Thus, these types of experiments are not totally predictive of changes that would occur in the ecosystem from which they were gathered.
As both of these approaches have their limitations, some ecologists suggest that results from these experimental systems should be used only in conjunction with holistic ecosystem studies to obtain the most representative data about ecosystem structure, function, and dynamics.
Scientists use the data generated by these experimental studies to develop ecosystem models that demonstrate the structure and dynamics of ecosystems. They use three basic types of ecosystem modeling in research and ecosystem management: a conceptual model, an analytical model, and a simulation model. A conceptual model is an ecosystem model that consists of flow charts to show interactions of different compartments of the living and nonliving components of the ecosystem. A conceptual model describes ecosystem structure and dynamics and shows how environmental disturbances affect the ecosystem; however, its ability to predict the effects of these disturbances is limited. Analytical and simulation models, in contrast, are mathematical methods of describing ecosystems that are indeed capable of predicting the effects of potential environmental changes without direct experimentation, although with some limitations as to accuracy. An analytical model is an ecosystem model that is created using simple mathematical formulas to predict the effects of environmental disturbances on ecosystem structure and dynamics. A simulation model is an ecosystem model that is created using complex computer algorithms to holistically model ecosystems and to predict the effects of environmental disturbances on ecosystem structure and dynamics. Ideally, these models are accurate enough to determine which components of the ecosystem are particularly sensitive to disturbances, and they can serve as a guide to ecosystem managers (such as conservation ecologists or fisheries biologists) in the practical maintenance of ecosystem health.
Conceptual Models
Conceptual models are useful for describing ecosystem structure and dynamics and for demonstrating the relationships between different organisms in a community and their environment. Conceptual models are usually depicted graphically as flow charts. The organisms and their resources are grouped into specific compartments with arrows showing the relationship and transfer of energy or nutrients between them. Thus, these diagrams are sometimes called compartment models.
To model the cycling of mineral nutrients, organic and inorganic nutrients are subdivided into those that are bioavailable (ready to be incorporated into biological macromolecules) and those that are not. For example, in a terrestrial ecosystem near a deposit of coal, carbon will be available to the plants of this ecosystem as carbon dioxide gas in a short-term period, not from the carbon-rich coal itself. However, over a longer period, microorganisms capable of digesting coal will incorporate its carbon or release it as natural gas (methane, CH₄), changing this unavailable organic source into an available one. This conversion is greatly accelerated by the combustion of fossil fuels by humans, which releases large amounts of carbon dioxide into the atmosphere. This is thought to be a major factor in the rise of the atmospheric carbon dioxide levels in the industrial age. The carbon dioxide released from burning fossil fuels is produced faster than photosynthetic organisms can use it. This process is intensified by the reduction of photosynthetic trees because of worldwide deforestation. Most scientists agree that high atmospheric carbon dioxide is a major cause of global climate change.
Conceptual models are also used to show the flow of energy through particular ecosystems. The figure below is based on Howard T. Odum’s classical study of the Silver Springs, Florida, holistic ecosystem in the mid-twentieth century (Howard T. Odum, “Trophic Structure and Productivity of Silver Springs, Florida,” Ecological Monographs 27, no. 1 (1957): 47–112). This study shows the energy content and transfer between various ecosystem compartments.
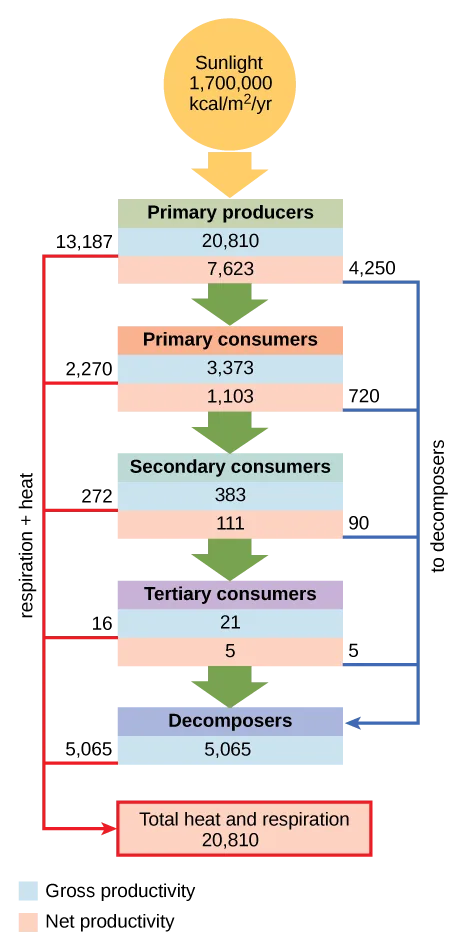
Extended description
Reading top to bottom. A Sunlight circle at the top reads 1,700,000 kcal/m²/yr, feeding a green arrow down into the Primary producers box, which prints two values stacked: 20,810 (light blue fill, Gross productivity) above 7,623 (salmon fill, Net productivity). A red line branches left from Primary producers labeled 13,187, running down the left margin; a blue line branches right labeled 4,250, running down the right margin. A green arrow carries the remainder down into Primary consumers, printing 3,373 above 1,103, with a red branch of 2,270 to the left margin and a blue branch of 720 to the right margin. A green arrow continues into Secondary consumers, printing 383 above 111, with a red branch of 272 and a blue branch of 90. A green arrow continues into Tertiary consumers, printing 21 above 5, with a red branch of 16 and a blue branch of 5. The right-margin blue line, having collected the 4,250, 720, 90, and 5 branches, arrives at a Decomposers box that prints 5,065. The left-margin red line, having collected the 13,187, 2,270, 272, and 16 branches plus the Decomposers box’s 5,065, arrives at a boxed label reading Total heat and respiration, 20,810. A key below the chart marks the light blue fill as Gross productivity and the salmon fill as Net productivity.
Why do you think the value for gross productivity of the primary producers is the same as the value for total heat and respiration (20,810 kcal/m²/yr)?
Show model answer
Did your answer mention:
Analytical and Simulation Models
The major limitation of conceptual models is their inability to predict the consequences of changes in ecosystem species and/or environment. Ecosystems are dynamic entities and subject to a variety of abiotic and biotic disturbances caused by natural forces and/or human activity. Ecosystems altered from their initial equilibrium state can often recover from such disturbances and return to a state of equilibrium. As most ecosystems are subject to periodic disturbances and are often in a state of change, they are usually either moving toward or away from their equilibrium state. There are many of these equilibrium states among the various components of an ecosystem, which affects the ecosystem overall. Furthermore, as humans have the ability to greatly and rapidly alter the species content and habitat of an ecosystem, the need for predictive models that enable understanding of how ecosystems respond to these changes becomes more crucial.
Analytical models often use simple, linear components of ecosystems, such as food chains, and are known to be complex mathematically; therefore, they require a significant amount of mathematical knowledge and expertise. Although analytical models have great potential, their simplification of complex ecosystems is thought to limit their accuracy. Simulation models that use computer programs are better able to deal with the complexities of ecosystem structure.
A recent development in simulation modeling uses supercomputers to create and run individual-based simulations, which accounts for the behavior of individual organisms and their effects on the ecosystem as a whole. These simulations are considered to be the most accurate and predictive of the complex responses of ecosystems to disturbances.
Summary
Ecosystems exist on land, at sea, in the air, and underground. Different ways of modeling ecosystems are necessary to understand how environmental disturbances will affect ecosystem structure and dynamics. Conceptual models are useful to show the general relationships between organisms and the flow of materials or energy between them. Analytical models are used to describe linear food chains, and simulation models work best with holistic food webs.
Key terms
- analytical model — ecosystem model that is created with mathematical formulas to predict the effects of environmental disturbances on ecosystem structure and dynamics
- apex consumer — organism at the top of the food chain
- conceptual model — (also, compartment model) ecosystem model that consists of flow charts that show the interactions of different compartments of the living and nonliving components of the ecosystem
- detrital food web — type of food web in which the primary consumers consist of decomposers; these are often associated with grazing food webs within the same ecosystem
- ecosystem — community of living organisms and their interactions with their abiotic environment
- ecosystem dynamics — study of the changes in ecosystem structure caused by changes in the environment or internal forces
- equilibrium — steady state of an ecosystem where all organisms are in balance with their environment and each other
- food chain — linear representation of a chain of primary producers, primary consumers, and higher-level consumers used to describe ecosystem structure and dynamics
- food web — graphic representation of a holistic, nonlinear web of primary producers, primary consumers, and higher-level consumers used to describe ecosystem structure and dynamics
- grazing food web — type of food web in which the primary producers are either plants on land or phytoplankton in the water; often associated with a detrital food web within the same ecosystem
- holistic ecosystem model — study that attempts to quantify the composition, interactions, and dynamics of entire ecosystems; often limited by economic and logistical difficulties, depending on the ecosystem
- mesocosm — portion of a natural ecosystem to be used for experiments
- microcosm — re-creation of natural ecosystems entirely in a laboratory environment to be used for experiments
- primary consumer — trophic level that obtains its energy from the primary producers of an ecosystem
- primary producer — trophic level that obtains its energy from sunlight, inorganic chemicals, or dead and/or decaying organic material
- resilience (ecological) — speed at which an ecosystem recovers equilibrium after being disturbed
- resistance (ecological) — ability of an ecosystem to remain at equilibrium in spite of disturbances
- secondary consumer — usually a carnivore that eats primary consumers
- simulation model — ecosystem model that is created with computer programs to holistically model ecosystems and to predict the effects of environmental disturbances on ecosystem structure and dynamics
- tertiary consumer — carnivore that eats other carnivores
- trophic level — position of a species or group of species in a food chain or a food web
Practice
Describe the basic ecosystem types
The ability of an ecosystem to return to its equilibrium state after an environmental disturbance is called ________.
One of these four terms differs from ‘resistance’ by describing how fast a system springs back after a disturbance, rather than whether it resists changing in the first place.Describe freshwater, ocean, and terrestrial ecosystems.
Show model answer
Did your answer mention:
A community of living organisms together with their interactions with the surrounding, nonliving physical environment is called a(n) ________.
This term names the whole system — the organisms plus the nonliving surroundings they interact with — not just the organisms by themselves.Explain the methods that ecologists use to study ecosystem structure and dynamics
A re-created ecosystem in a laboratory environment is known as a ________.
The word is built from a prefix meaning ‘small’ plus ‘world’ — think about rebuilding an entire ecosystem indoors, as opposed to only partitioning off a piece of a natural one.How does the microcosm modeling approach differ from utilizing a holistic model for ecological research?
Show model answer
Did your answer mention:
A portion of a natural setting that is partitioned off and used for controlled experiments, without fully recreating the ecosystem indoors, is called a ________.
This is the option that still uses a piece of the original natural setting, rather than rebuilding an ecosystem entirely in an indoor or outdoor laboratory.The study of the changes in structure of a natural system, caused by shifts in its environment or by forces within it, is called ________.
Pair the word for the community-plus-environment system being studied with the word ecologists use for its ongoing pattern of change.Identify the different methods of ecosystem modeling
What term describes the use of mathematical equations in the modeling of linear aspects of ecosystems?
This approach uses simple mathematical formulas rather than flow charts or complex computer algorithms — which of the four names literally points at ‘using equations’?How do conceptual and analytical models of ecosystems complement each other?
Show model answer
Did your answer mention:
An ecosystem model built from flow charts that show how the living and nonliving parts of a system interact is called a(n) ________.
This is the descriptive, flow-chart type of model, not the kind built from mathematical formulas or from complex computer code.An ecosystem model built using complex computer programs to holistically predict how disturbances will affect a system is called a(n) ________.
This is the most computationally demanding of the three model types, capable of running individual-based modeling of every organism.Differentiate between food chains and food webs and recognize the importance of each
Decomposers are associated with which class of food web?
Recall which type of food web is built on organisms that feed on dead and decaying matter rather than on living producers.The primary producers in an ocean grazing food web are usually ________.
Land-based grazing food webs start with plants — what is the ocean’s photosynthetic equivalent, floating near the water’s surface?The position of an organism along a food chain is known as its ________.
This term names an organism’s specific rung on the producer-or-consumer ladder, not a general word for ‘place.’The loss of an apex consumer would impact which trophic level of a food web?
Removing the top of a food web can ripple down through every level beneath it — consider how many trophic levels ultimately depend, directly or indirectly, on what the apex consumer keeps in check.A food chain would be a better resource than a food web to answer which question?
A food chain draws a single linear path — which question asks about movement along just that one path, rather than something only a web’s overlapping connections could show?Compare and contrast food chains and food webs. What are the strengths of each concept in describing ecosystems?
Show model answer
Did your answer mention:
Compare grazing and detrital food webs. Why would they both be present in the same ecosystem?
Show model answer
Did your answer mention:
This section is adapted from Biology 2e, Section 46.1: Ecology of Ecosystems by Mary Ann Clark, Jung Choi, Matthew Douglas, and OpenStax, © OpenStax, licensed under CC BY-NC-SA 4.0. Access the original for free at openstax.org. Changes: figures re-encoded as WebP; Figure_46_01_03 (the Lake Ontario food chain) and Figure_46_01_04 (the trophic-level bar graph) re-kinded from the manifest’s file-extension “photo” guess to “diagram” (both are illustrations, not captured photographs); a longdesc added to Figure_46_01_03, Figure_46_01_04, Figure_B46_01_05, and Figure_46_01_07-b018, each walking the diagram in reading order and, for the two graphs, transcribing every printed value or axis position (the Visual Connection figure’s longdesc names only the printed values and arrows and never states the first-law reasoning that answers the question beneath it); the Figure_B46_01_05 food web’s long source alt (1,371 characters, over the 600-character limit) was shortened to a plain visible-structure description with the full organism list, tier colors, and the six feeding exceptions moved into its longdesc; the source’s underline emphasis on “Food Web” in the food-web Link to Learning note is rendered as bold; both Link to Learning notes rendered as callouts with descriptive link text, keeping the source’s own openstax.org/l/ redirect URLs exactly as printed, including the second Darwin-Project URL’s own misspelling (“Darwin_projct2”); the evolution note (“Evolution Connection. Three-spined Stickleback.”) rendered as a callout with its figure and footnote citation kept inline as a parenthetical; the end-of-section Review Questions and Critical Thinking Questions adapted into the closing interactive Practice block (multiple choice and self-check respectively), and the Visual Connection kept in the body, immediately after its figure, as a self-check (the module keys it with prose, not a lettered choice); rubric checkpoints added to every self-check, decomposing its model answer (the source solution) into check-off clauses with no new claims; five key-term recall items added from the glossary (ecosystem, mesocosm, ecosystem dynamics, conceptual model, simulation model) to give two Practice groups an additional auto-graded item; four-plus-digit energy values in prose given digit-grouping commas for consistency with the figures (3368 → 3,368); no summary or locally authored practice item was needed — the module’s fourteen keyed exercises already meet the section’s practice floor with every objective covered by at least one source item. Source defect: module m66701’s own prose (paragraph beginning “The loss of energy between trophic levels…”) states the primary producers’ and primary consumers’ Silver Springs values as 20,819 and 3,368 kcal/m²/yr, while the module’s own Figure_46_01_07-b018 (the Visual Connection energy-flow diagram, drawing on the same Odum 1957 study) prints 20,810 and 3,373 kcal/m²/yr for the same two quantities — both figures are printed as shown in the pinned CNXML and the local PDF (pp. 1376 and 1381), reported here as a source defect rather than corrected, since the page transcribes each value exactly as printed in its own location. One date is corrected with a visible Source note: Odum’s Silver Springs study is from the 1950s, not the 1940s (erratum 457).