Energy Flow through Ecosystems
By the end of this section, you will be able to:
- Describe how organisms acquire energy in a food web and in associated food chains
- Explain how the efficiency of energy transfers between trophic levels affects ecosystem structure and dynamics
- Discuss trophic levels and how ecological pyramids are used to model them
All living things require energy in one form or another. Energy is required by most complex metabolic pathways (often in the form of adenosine triphosphate, ATP), especially those responsible for building large molecules from smaller compounds, and life itself is an energy-driven process. Living organisms would not be able to assemble macromolecules (proteins, lipids, nucleic acids, and complex carbohydrates) from their monomeric subunits without a constant energy input.
It is important to understand how organisms acquire energy and how that energy is passed from one organism to another through food webs and their constituent food chains. Food webs illustrate how energy flows directionally through ecosystems, including how efficiently organisms acquire it, use it, and how much remains for use by other organisms of the food web.
How Organisms Acquire Energy in a Food Web
Energy is acquired by living things in three ways: photosynthesis, chemosynthesis, and the consumption and digestion of other living or previously living organisms by heterotrophs.
Photosynthetic and chemosynthetic organisms are both grouped into a category known as autotrophs: organisms capable of synthesizing their own food (more specifically, capable of using inorganic carbon as a carbon source). Photosynthetic autotrophs (photoautotrophs) use sunlight as an energy source, whereas chemosynthetic autotrophs (chemoautotrophs) use inorganic molecules as an energy source. Autotrophs are critical for all ecosystems. Without these organisms, energy would not be available to other living organisms and life itself would not be possible.
Photoautotrophs, such as plants, algae, and photosynthetic bacteria, serve as the energy source for a majority of the world’s ecosystems. These ecosystems are often described by grazing food webs. Photoautotrophs harness the solar energy of the sun by converting it to chemical energy in the form of ATP (and NADP). The energy stored in ATP is used to synthesize complex organic molecules, such as glucose.
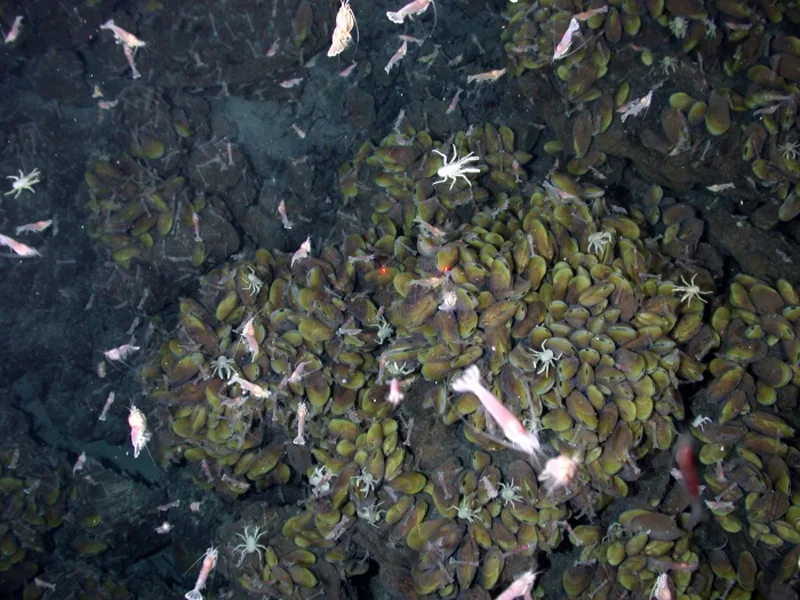
Chemoautotrophs are primarily bacteria that are found in rare ecosystems where sunlight is not available, such as in those associated with dark caves or hydrothermal vents at the bottom of the ocean, shown below. Many chemoautotrophs in hydrothermal vents use hydrogen sulfide (H₂S), which is released from the vents as a source of chemical energy. This allows chemoautotrophs to synthesize complex organic molecules, such as glucose, for their own energy and in turn supplies energy to the rest of the ecosystem.
Productivity within Trophic Levels
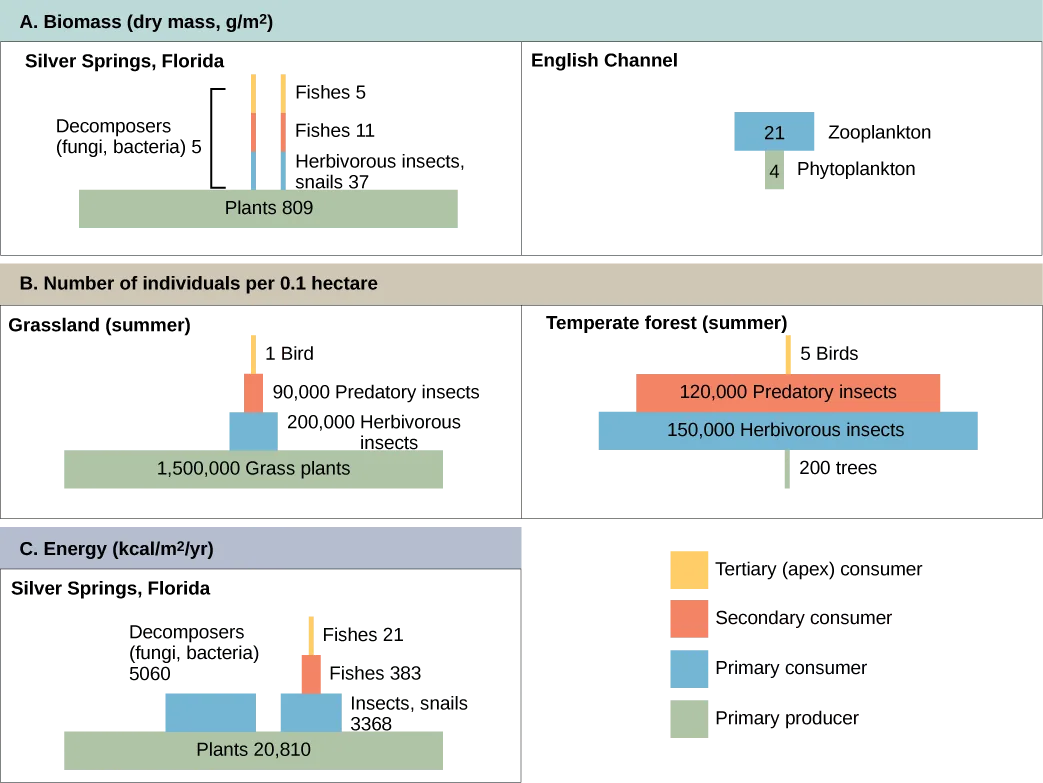
Productivity within an ecosystem can be defined as the percentage of energy entering the ecosystem incorporated into biomass in a particular trophic level. Biomass is the total mass, in a unit area at the time of measurement, of living or previously living organisms within a trophic level. Ecosystems have characteristic amounts of biomass at each trophic level. For example, in the English Channel ecosystem the primary producers account for a biomass of 4 g/m² (grams per square meter), while the primary consumers exhibit a biomass of 21 g/m².
The productivity of the primary producers is especially important in any ecosystem because these organisms bring energy to other living organisms by photoautotrophy or chemoautotrophy. The rate at which photosynthetic primary producers incorporate energy from the sun is called gross primary productivity. An example of gross primary productivity is shown in the compartment diagram of energy flow within the Silver Springs aquatic ecosystem, described in the previous section. In this ecosystem, the total energy accumulated by the primary producers (gross primary productivity) was shown to be 20,810 kcal/m²/yr.
Because all organisms need to use some of this energy for their own functions (like respiration and resulting metabolic heat loss) scientists often refer to the net primary productivity of an ecosystem. Net primary productivity is the energy that remains in the primary producers after accounting for the organisms’ respiration and heat loss. The net productivity is then available to the primary consumers at the next trophic level. In our Silver Springs example, 13,187 of the 20,810 kcal/m²/yr were used for respiration or were lost as heat, leaving 7,633 kcal/m²/yr of energy for use by the primary consumers.
Ecological Efficiency: The Transfer of Energy between Trophic Levels
As illustrated by the Silver Springs energy-flow diagram described in the previous section, as energy flows from primary producers through the various trophic levels, the ecosystem loses large amounts of energy. The main reason for this loss is the second law of thermodynamics, which states that whenever energy is converted from one form to another, there is a tendency toward disorder (entropy) in the system. In biologic systems, this energy takes the form of metabolic heat, which is lost when the organisms consume other organisms. In the Silver Springs ecosystem example, we see that the primary consumers produced 1103 kcal/m²/yr from the 3373 kcal/m²/yr of energy available to them from the primary producers. (The primary consumers used 3373 kcal/m²/yr from the 7618 kcal/m²/yr produced by the primary producers, as 4250 kcal/m²/yr goes to the decomposers.) The measurement of energy transfer efficiency between two successive trophic levels is termed the trophic level transfer efficiency (TLTE) and is defined by the formula:
In Silver Springs, the TLTE between the first two trophic levels was approximately 14.48 percent. The low efficiency of energy transfer between trophic levels is usually the major factor that limits the length of food chains observed in a food web. The fact is, after four to six energy transfers, there is not enough energy left to support another trophic level. In the Lake Ontario example, only three energy transfers occurred between the primary producer (green algae) and the apex consumer (Chinook salmon).
Ecologists have many different methods of measuring energy transfers within ecosystems. Measurement difficulty depends on the complexity of the ecosystem and how much access scientists have to observe the ecosystem. In other words, some ecosystems are more difficult to study than others, and sometimes the quantification of energy transfers has to be estimated.
Other parameters are important in characterizing energy flow within an ecosystem. Net production efficiency (NPE) allows ecologists to quantify how efficiently organisms of a particular trophic level incorporate the energy they receive into biomass; it is calculated using the following formula:
Net consumer productivity is the energy content available to the organisms of the next trophic level. Assimilation is the biomass (energy content generated per unit area) of the present trophic level after accounting for the energy lost due to incomplete ingestion of food, energy used for respiration, and energy lost as waste. Incomplete ingestion refers to the fact that some consumers eat only a part of their food. For example, when a lion kills an antelope, it will eat everything except the hide and bones. The lion is missing the energy-rich bone marrow inside the bone, so the lion does not make use of all the calories its prey could provide.
Thus, NPE measures how efficiently each trophic level uses and incorporates the energy from its food into biomass to fuel the next trophic level. In general, cold-blooded animals (ectotherms), such as invertebrates, fish, amphibians, and reptiles, use less of the energy they obtain for respiration and heat than warm-blooded animals (endotherms), such as birds and mammals. The extra heat generated in endotherms, although an advantage in terms of the activity of these organisms in colder environments, is a major disadvantage in terms of NPE. Therefore, many endotherms have to eat more often than ectotherms to get the energy they need for survival. In general, NPE for ectotherms is an order of magnitude (10x) higher than for endotherms. For example, the NPE for a caterpillar eating leaves has been measured at 18 percent, whereas the NPE for a squirrel eating acorns may be as low as 1.6 percent.
The inefficiency of energy use by warm-blooded animals has broad implications for the world’s food supply. It is widely accepted that the meat industry uses large amounts of crops to feed livestock, and because the NPE is low, much of the energy from animal feed is lost. For example, it costs about $0.01 to produce 1000 dietary calories (kcal) of corn or soybeans, but approximately $0.19 to produce a similar number of calories growing cattle for beef consumption. The same energy content of milk from cattle is also costly, at approximately $0.16 per 1000 kcal. Much of this difference is due to the low NPE of cattle. Thus, there has been a growing movement worldwide to promote the consumption of nonmeat and nondairy foods so that less energy is wasted feeding animals for the meat industry.
Modeling Ecosystems Energy Flow: Ecological Pyramids
The structure of ecosystems can be visualized with ecological pyramids, which were first described by the pioneering studies of Charles Elton in the 1920s. Ecological pyramids show the relative amounts of various parameters (such as number of organisms, energy, and biomass) across trophic levels.
Pyramids of numbers can be either upright or inverted, depending on the ecosystem. As shown below, typical grassland during the summer has a base of many plants, and the numbers of organisms decrease at each trophic level. However, during the summer in a temperate forest, the base of the pyramid consists of few trees compared with the number of primary consumers, mostly insects. Because trees are large, they have great photosynthetic capability, and dominate other plants in this ecosystem to obtain sunlight. Even in smaller numbers, primary producers in forests are still capable of supporting other trophic levels.
Another way to visualize ecosystem structure is with pyramids of biomass. This pyramid measures the amount of energy converted into living tissue at the different trophic levels. Using the Silver Springs ecosystem example, this data exhibits an upright biomass pyramid, shown below, whereas the pyramid from the English Channel example is inverted. The plants (primary producers) of the Silver Springs ecosystem make up a large percentage of the biomass found there. However, the phytoplankton in the English Channel example make up less biomass than the primary consumers, the zooplankton. As with inverted pyramids of numbers, this inverted pyramid is not due to a lack of productivity from the primary producers, but results from the high turnover rate of the phytoplankton. The phytoplankton are consumed rapidly by the primary consumers, thus, minimizing their biomass at any particular point in time. However, phytoplankton reproduce quickly, thus they are able to support the rest of the ecosystem.
Pyramid ecosystem modeling can also be used to show energy flow through the trophic levels. Notice that these numbers are the same as those used in the energy flow compartment diagram described in the previous section. Pyramids of energy are always upright, and an ecosystem without sufficient primary productivity cannot be supported. All types of ecological pyramids are useful for characterizing ecosystem structure. However, in the study of energy flow through the ecosystem, pyramids of energy are the most consistent and representative models of ecosystem structure.
Extended description
Panel A, Biomass (dry mass, g/m²), two pyramids side by side. Left, Silver Springs, Florida: a wide green bar ‘Plants 809’ at the bottom; above it, three progressively narrower bars stacked in this order: a blue bar ‘Herbivorous insects, snails 37’, an orange bar ‘Fishes 11’, and a yellow bar ‘Fishes 5’ at the top; a bracket beside those three bars is labeled ‘Decomposers (fungi, bacteria) 5’. Right, English Channel: only two bars — a blue bar ‘Zooplankton 21’ sits above a shorter green bar ‘Phytoplankton 4’, the top bar wider than the one beneath it. Panel B, Number of individuals per 0.1 hectare, two pyramids side by side. Left, Grassland (summer): a wide green bar ‘1,500,000 Grass plants’ at the bottom, then progressively narrower bars going up — blue ‘200,000 Herbivorous insects’, orange ‘90,000 Predatory insects’, and a thin yellow line ‘1 Bird’ at the top. Right, Temperate forest (summer): a narrow green bar ‘200 trees’ at the bottom, then a wider blue bar ‘150,000 Herbivorous insects’ above it, an orange bar ‘120,000 Predatory insects’ about as wide as the blue bar, and a thin yellow line ‘5 Birds’ at the top. Panel C, Energy (kcal/m²/yr): on the left, Silver Springs, Florida, one pyramid — a wide green bar ‘Plants 20,810’ at the bottom; standing on it, side by side, a separate blue bar at the left labeled ‘Decomposers (fungi, bacteria) 5060’ and, to its right, the stacked column of a blue bar ‘Insects, snails 3368’, an orange bar ‘Fishes 383’, and a yellow bar ‘Fishes 21’ at the top — no bracket in this panel; on the right, in place of a second pyramid, a legend with four color swatches, top to bottom: yellow ‘Tertiary (apex) consumer’, orange ‘Secondary consumer’, blue ‘Primary consumer’, green ‘Primary producer’.
Pyramids depicting the number of organisms or biomass may be inverted, upright, or even diamond-shaped. Energy pyramids, however, are always upright. Why?
Show model answer
Did your answer mention:
Consequences of Food Webs: Biological Magnification
One of the most important environmental consequences of ecosystem dynamics is biomagnification. Biomagnification is the increasing concentration of persistent, toxic substances in organisms at each trophic level, from the primary producers to the apex consumers. Many substances have been shown to bioaccumulate, including the pesticide dichlorodiphenyltrichloroethane (DDT), which was described in the 1960s bestseller, Silent Spring, by marine biologist Rachel Carson. DDT was a commonly used pesticide before its dangers became known. In some aquatic ecosystems, organisms from each trophic level consumed many organisms of the lower level, which caused DDT to increase in birds (apex consumers) that ate fish. Thus, the birds accumulated sufficient amounts of DDT to cause fragility in their eggshells. This effect increased egg breakage during nesting and was shown to have adverse effects on these bird populations. Carson’s combination of scientific knowledge and illuminating writing helped raise awareness about overall environmental issues as well as the specifics of the pesticide. The use of DDT was banned in the United States in the 1970s.
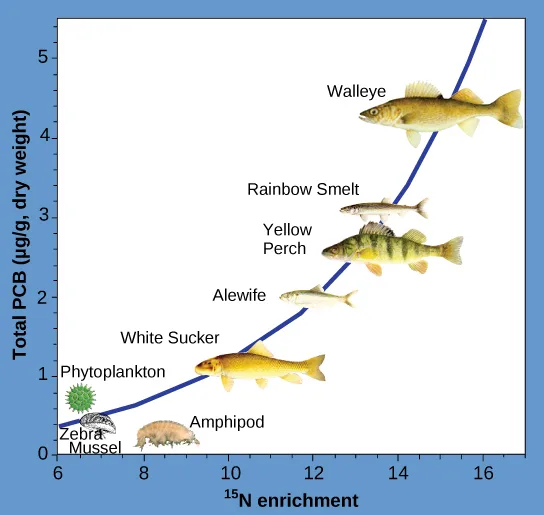
Other substances that biomagnify are polychlorinated biphenyls (PCBs), which were used in coolant liquids in the United States until their use was banned in 1979, and heavy metals, such as mercury, lead, and cadmium. These substances were best studied in aquatic ecosystems, where fish species at different trophic levels accumulate toxic substances brought through the ecosystem by the primary producers. As illustrated in a study performed by the National Oceanic and Atmospheric Administration (NOAA) in the Saginaw Bay of Lake Huron, shown below, PCB concentrations increased from the ecosystem’s primary producers (phytoplankton) through the different trophic levels of fish species. The apex consumer (walleye) has more than four times the amount of PCBs compared to phytoplankton. Also, based on results from other studies, birds that eat these fish may have PCB levels at least one order of magnitude higher than those found in the lake fish.
Extended description
The vertical axis is labeled Total PCB (µg/g, dry weight) and runs from 0 to 5; the horizontal axis is labeled ¹⁵N enrichment and runs from 6 to 16. A blue curve rises from the lower left to the upper right. Reading along it from lowest to highest: Phytoplankton (a small green spiky icon) and Zebra Mussel (a striped shell icon) sit together near the bottom, just above a total PCB of 0; next, Amphipod (a small brown segmented icon) sits slightly higher and to the right; then White Sucker (a golden fish icon) at just above 1; then Alewife (a small silver fish) at just under 2; then Yellow Perch (a striped fish) at about 2.5; then Rainbow Smelt (a slender fish) at about 3.3; and finally Walleye (the largest fish icon), at the upper right, near a total PCB of 4.3.
Other concerns have been raised by the accumulation of heavy metals, such as mercury and cadmium, in certain types of seafood. The United States Environmental Protection Agency (EPA) recommends that pregnant people and young children should not consume any swordfish, shark, king mackerel, or tilefish because of their high mercury content. These individuals are advised to eat fish low in mercury: salmon, tilapia, shrimp, pollock, and catfish. Biomagnification is a good example of how ecosystem dynamics can affect our everyday lives, even influencing the food we eat.
Summary
Organisms in an ecosystem acquire energy in a variety of ways, which is transferred between trophic levels as the energy flows from the bottom to the top of the food web, with energy being lost at each transfer. The efficiency of these transfers is important for understanding the different behaviors and eating habits of warm-blooded versus cold-blooded animals. Modeling of ecosystem energy is best done with ecological pyramids of energy, although other ecological pyramids provide other vital information about ecosystem structure.
Key terms
- assimilation — biomass consumed and assimilated from the previous trophic level after accounting for the energy lost due to incomplete ingestion of food, energy used for respiration, and energy lost as waste
- biomagnification — increasing concentrations of persistent, toxic substances in organisms at each trophic level, from the primary producers to the apex consumers
- biomass — total weight, at the time of measurement, of living or previously living organisms in a unit area within a trophic level
- chemoautotroph — organism capable of synthesizing its own food using energy from inorganic molecules
- ecological pyramid — (also, Eltonian pyramid) graphical representation of different trophic levels in an ecosystem based on organism numbers, biomass, or energy content
- gross primary productivity — rate at which photosynthetic primary producers incorporate energy from the sun
- net consumer productivity — energy content available to the organisms of the next trophic level
- net primary productivity — energy that remains in the primary producers after accounting for the organisms’ respiration and heat loss
- net production efficiency (NPE) — measure of the ability of a trophic level to convert the energy it receives from the previous trophic level into biomass
- trophic level transfer efficiency (TLTE) — energy transfer efficiency between two successive trophic levels
Practice
Describe how organisms acquire energy in a food web and in associated food chains
The mussels that live at the NW Eifuku volcano are examples of _______.
The section says chemoautotrophic bacteria make the food at this vent — decide whether the mussels are the ones making that food or the ones eating it.Choose the term that encompasses all organisms that can make their own food using inorganic molecules:
The section names one broad category that groups together the organisms that use sunlight and the organisms that use inorganic molecules as their energy source — look for the word that covers both, not only the subset that skips photosynthesis.Which term describes the process whereby toxic substances increase along trophic levels of an ecosystem?
Re-read the paragraph describing DDT and PCBs increasing up the food chain — the correct option is the section’s own name for that specific process, not a word invented to sound similar.An organism capable of synthesizing its own food using energy from inorganic molecules is called a ________.
This organism lives in places without sunlight, such as dark caves or hydrothermal vents, and uses an inorganic energy source such as hydrogen sulfide instead of sunlight.Explain how the efficiency of energy transfers between trophic levels affects ecosystem structure and dynamics
The weight of living organisms in an ecosystem at a particular point in time is called:
This term is bolded early in the Productivity section and defined as a total weight measured in a unit area — the other three options name different concepts entirely.In the English Channel ecosystem, the number of primary producers is smaller than the number of primary consumers because________.
The passage on the inverted English Channel biomass pyramid explains this exact example — decide whether the producers replace themselves quickly or slowly.What law of chemistry determines how much energy can be transferred when it is converted from one form to another?
This is the law named right after the section describes energy loss as metabolic heat during every transfer — not the law about matter or energy being conserved.How does the amount of food a warm-blooded animal (endotherm) eats relate to its net production efficiency (NPE)?
Show model answer
Did your answer mention:
The biomass of the present trophic level after accounting for the energy lost to incomplete ingestion, respiration, and waste is called ________.
This is the denominator of the NPE formula — the energy actually taken in and kept after incomplete eating, respiration, and waste are subtracted.The measure of how well a trophic level converts the energy it receives from the previous trophic level into biomass is called ________.
This measure is much higher in cold-blooded ectotherms than in warm-blooded endotherms, because endotherms lose more energy as body heat.Discuss trophic levels and how ecological pyramids are used to model them
Compare the three types of ecological pyramids and how well they describe ecosystem structure. Identify which ones can be inverted and give an example of an inverted pyramid for each.
Show model answer
Did your answer mention:
A study uses an inverted pyramid to demonstrate the relationship between sharks, their aquatic prey, and phytoplankton in an ocean region. What type of pyramid must be used? What does this convey to readers about predation in the area?
Show model answer
Did your answer mention:
Describe what a pyramid of numbers would look like if an ecologist models the relationship between bird parasites, blue jays, and oak trees in a hectare. Does this match the energy flow pyramid?
Show model answer
Did your answer mention:
A graphical representation of different trophic levels in an ecosystem based on organism numbers, biomass, or energy content is called a(n) ________.
This shape-based model, pioneered by Charles Elton in the 1920s, plots numbers, biomass, or energy from bottom to top through a food web’s trophic levels.This section is adapted from Biology 2e, Section 46.2: Energy Flow through Ecosystems by Mary Ann Clark, Jung Choi, Matthew Douglas, and OpenStax, © OpenStax, licensed under CC BY-NC-SA 4.0. Access the original for free at openstax.org. Changes: figures re-encoded as WebP; Figure_46_02_03 re-kinded from the media manifest’s file-extension “photo” guess to “diagram” (it is a drawn line chart with illustrated fish and invertebrate icons along the curve, not a captured photograph); a longdesc added to Figure_46_02_02 and Figure_46_02_03, each transcribing every printed value, bar, and labeled organism in reading order (the ecological-pyramids figure’s longdesc names only what is drawn and never states why energy pyramids alone are always upright); the module’s four cross-references to the Silver Springs energy-flow compartment diagram in the adjoining section 46.1 (fig-ch46_01_07, printed as “Figure 46.8”) are reworded as prose descriptions (“described in the previous section”) since that figure is not vendored on this page; two equations (trophic level transfer efficiency and net production efficiency) set as display math ($$…$$) with \text{} around each word phrase, matching the module’s own MathML structure; the module’s own Visual Connection is kept in the body immediately after its figure as a self-check, since the source keys it with prose rather than a lettered option — its <exercise> copy (fs-idm113565312) is used for the model answer, and it is not duplicated in Practice; rubric checkpoints added to each self-check, decomposing its model answer (the source solution) into check-off clauses with no new claims; the end-of-section Review Questions and Critical Thinking Questions adapted into the closing interactive Practice block (multiple choice and self-check respectively); four key-term recall items added from the glossary (chemoautotroph, assimilation, net production efficiency, ecological pyramid), covering four of the section’s ten glossary terms — the rest (biomagnification, biomass, gross primary productivity, net consumer productivity, net primary productivity, trophic level transfer efficiency) appear only in the Key terms list and the prose, several as the bolded defining term of their own paragraph, and biomagnification and biomass are additionally exercised as select-the-term multiple choice from the Review Questions. The glossary entry for “ecological pyramid” prints “based of organism numbers” in the source; the page reads “based on” (reported as a source defect). The module quotes the Silver Springs net production as 7,633 kcal/m²/yr in one paragraph and 7618 in the next, and the primary consumers’ available energy as 3373 in prose where the pyramid figure prints 3368; each number is kept as its own location prints it (reported as a source defect). Source keys: Review Question fs-idm130633648 (“Choose the term that encompasses all organisms that can make their own food using inorganic molecules”) is source-keyed D, chemoautotrophs; the module’s own text — “Photosynthetic and chemosynthetic organisms are both grouped into a category known as autotrophs: organisms capable of synthesizing their own food (more specifically, capable of using inorganic carbon as a carbon source)” — makes autotrophs, not chemoautotrophs, the term that encompasses both photoautotrophs and chemoautotrophs, so this page keys A, autotrophs. Review Question eip-183 (the NW Eifuku mussels) is kept on source authority as D, primary consumers: the module states “the ecosystem is supported by chemoautotrophic bacteria and organic material that sinks from the ocean’s surface,” so the mussels that feed there are consumers of that food, not the chemoautotrophs that make it.