How Microbes Grow
By the end of this section, you will be able to:
- Define the generation time for growth based on binary fission
- Identify and describe the activities of microorganisms undergoing typical phases of binary fission (simple cell division) in a growth curve
- Explain several laboratory methods used to determine viable and total cell counts in populations undergoing exponential growth
- Describe examples of cell division not involving binary fission, such as budding or fragmentation
- Describe the formation and characteristics of biofilms
- Identify health risks associated with biofilms and how they are addressed
- Describe quorum sensing and its role in cell-to-cell communication and coordination of cellular activities
Clinical Focus. Part 1
Jeni, a 24-year-old pregnant woman in her second trimester, visits a clinic with complaints of high fever, 38.9 °C (102 °F), fatigue, and muscle aches—typical flu-like signs and symptoms. Jeni exercises regularly and follows a nutritious diet with emphasis on organic foods, including raw milk that she purchases from a local farmer’s market. All of her immunizations are up to date. However, the health-care provider who sees Jeni is concerned and orders a blood sample to be sent for testing by the microbiology laboratory.
- Why is the health-care provider concerned about Jeni’s signs and symptoms?
The case continues in Oxygen Requirements for Microbial Growth.
The bacterial cell cycle involves the formation of new cells through the replication of DNA and partitioning of cellular components into two daughter cells. In prokaryotes, reproduction is always asexual, although extensive genetic recombination in the form of horizontal gene transfer takes place, as will be explored in a different chapter. Most bacteria have a single circular chromosome; however, some exceptions exist. For example, Borrelia burgdorferi, the causative agent of Lyme disease, has a linear chromosome.
Binary Fission
The most common mechanism of cell replication in bacteria is a process called binary fission, depicted below. Before dividing, the cell grows and increases its number of cellular components. Next, the replication of DNA starts at a location on the circular chromosome called the origin of replication, where the chromosome is attached to the inner cell membrane. Replication continues in opposite directions along the chromosome until the terminus is reached.
The center of the enlarged cell constricts until two daughter cells are formed, each offspring receiving a complete copy of the parental genome and a division of the cytoplasm (cytokinesis). This process of cytokinesis and cell division is directed by a protein called FtsZ. FtsZ assembles into a Z ring on the cytoplasmic membrane, shown in the second figure below. The Z ring is anchored by FtsZ-binding proteins and defines the division plane between the two daughter cells. Additional proteins required for cell division are added to the Z ring to form a structure called the divisome. The divisome activates to produce a peptidoglycan cell wall and build a septum that divides the two daughter cells. The daughter cells are separated by the division septum, where all of the cells’ outer layers (the cell wall and outer membranes, if present) must be remodeled to complete division. For example, we know that specific enzymes break bonds between the monomers in peptidoglycans and allow addition of new subunits along the division septum.
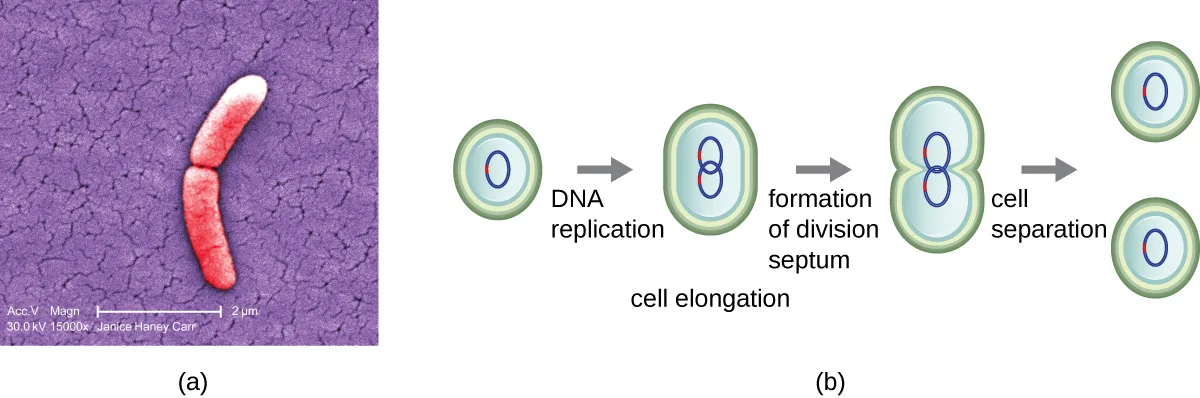
Extended description
Panel (b) shows four stages connected by arrows, left to right. First, a single round cell containing one small loop of DNA. Second, labeled cell elongation and DNA replication, the cell has grown longer and now contains two DNA loops, one nearer each end. Third, labeled formation of division septum, the elongated cell has pinched inward at its center into a figure-eight shape while still holding the two DNA loops. Fourth, labeled cell separation, two round daughter cells have fully separated, each containing one DNA loop.
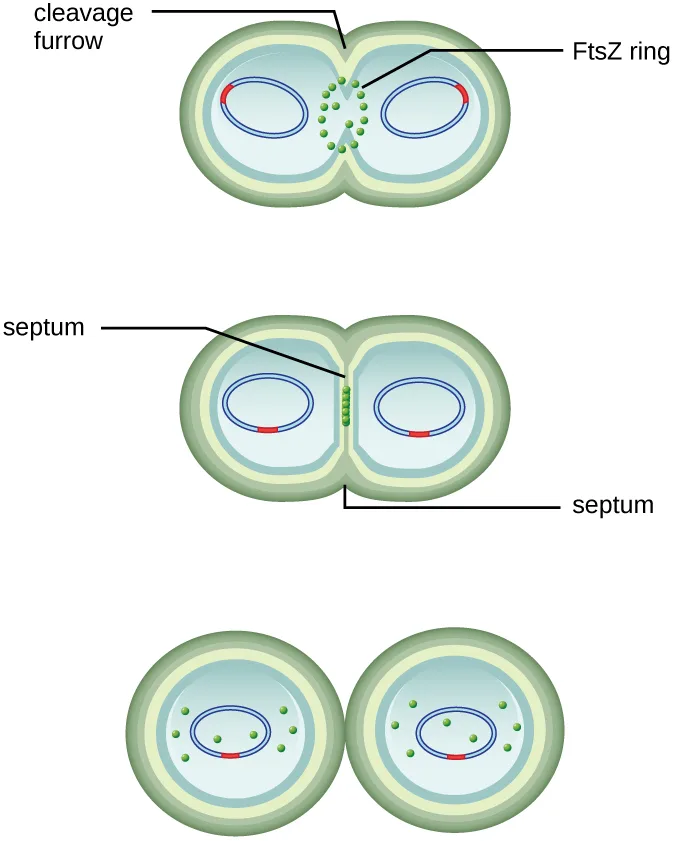
Extended description
Stage 1: a figure-eight-shaped cell with a loop of DNA in each lobe; a ring of green dots circles the pinched middle, labeled cleavage furrow and FtsZ ring. Stage 2: the green dots have lined up in a single row spanning the narrowed middle, labeled septum, still with a DNA loop in each lobe. Stage 3: two separate round cells, each containing one DNA loop and a few scattered green dots, with no ring remaining.
Check Your Understanding
What is the name of the protein that assembles into a Z ring to initiate cytokinesis and cell division?
Name the protein that assembles into the Z ring, given a few sentences after binary fission is introduced.Generation Time
In eukaryotic organisms, the generation time is the time between the same points of the life cycle in two successive generations. For example, the typical generation time for the human population is 25 years. This definition is not practical for bacteria, which may reproduce rapidly or remain dormant for thousands of years. In prokaryotes (Bacteria and Archaea), the generation time is also called the doubling time and is defined as the time it takes for the population to double through one round of binary fission. Bacterial doubling times vary enormously. Whereas Escherichia coli can double in as little as 20 minutes under optimal growth conditions in the laboratory, bacteria of the same species may need several days to double in especially harsh environments. Most pathogens grow rapidly, like E. coli, but there are exceptions. For example, Mycobacterium tuberculosis, the causative agent of tuberculosis, has a generation time of between 15 and 20 hours. On the other hand, M. leprae, which causes Hansen’s disease (leprosy), grows much more slowly, with a doubling time of 14 days.
Micro Connection. Calculating Number of Cells
It is possible to predict the number of cells in a population when they divide by binary fission at a constant rate. As an example, consider what happens if a single cell divides every 30 minutes for 24 hours. The diagram below shows the increase in cell numbers for the first three generations.
The number of cells increases exponentially and can be expressed as 2ⁿ, where n is the number of generations. If cells divide every 30 minutes, after 24 hours, 48 divisions would have taken place. If we apply the formula 2ⁿ, where n is equal to 48, the single cell would give rise to or 281,474,976,710,656 cells at 48 generations (24 hours). When dealing with such huge numbers, it is more practical to use scientific notation. Therefore, we express the number of cells as cells.
In our example, we used one cell as the initial number of cells. For any number of starting cells, the formula is adapted as follows:
Nₙ is the number of cells at any generation n, N₀ is the initial number of cells, and n is the number of generations.
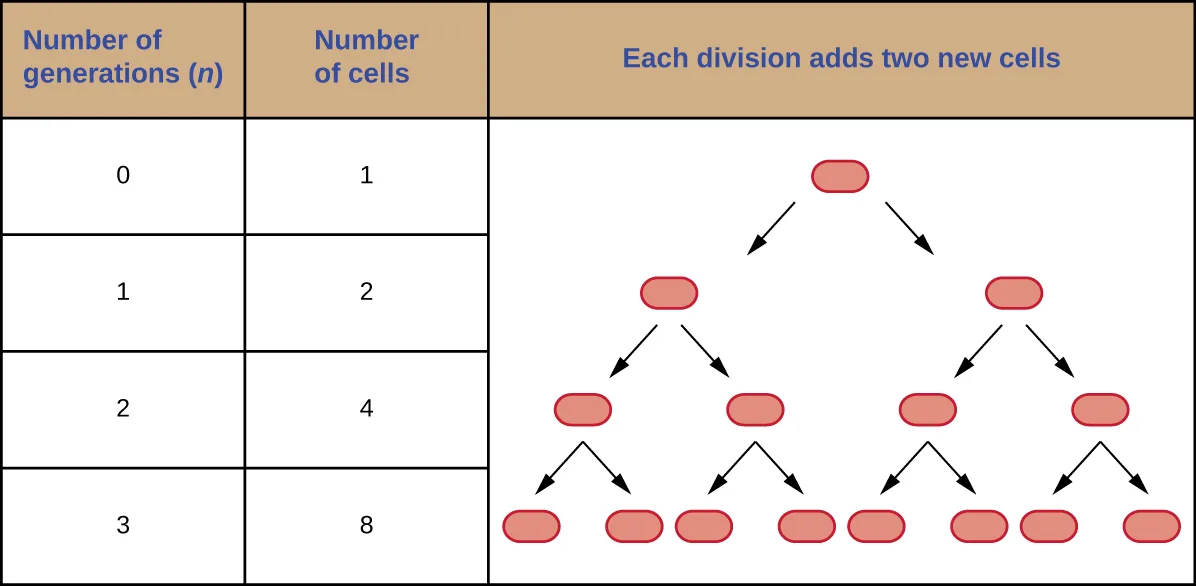
Extended description
The table lists generation 0 with 1 cell, generation 1 with 2 cells, generation 2 with 4 cells, and generation 3 with 8 cells. The tree diagram beside it shows a single cell at the top with two arrows branching down to two cells (generation 1); each of those two cells has two arrows branching down to a total of four cells (generation 2); each of those four cells has two arrows branching down to a total of eight cells (generation 3).
Check Your Understanding
With a doubling time of 30 minutes and a starting population size ofcells, how many cells will be present after 2 hours, assuming no cell death?
Two hours at a 30-minute doubling time is four generations; apply Nₙ = N₀2ⁿ withand n = 4.The Growth Curve
Microorganisms grown in closed culture (also known as a batch culture), in which no nutrients are added and most waste is not removed, follow a reproducible growth pattern referred to as the growth curve. An example of a batch culture in nature is a pond in which a small number of cells grow in a closed environment. The culture density is defined as the number of cells per unit volume. In a closed environment, the culture density is also a measure of the number of cells in the population. Infections of the body do not always follow the growth curve, but correlations can exist depending upon the site and type of infection. When the number of live cells is plotted against time, distinct phases can be observed in the curve, shown below.
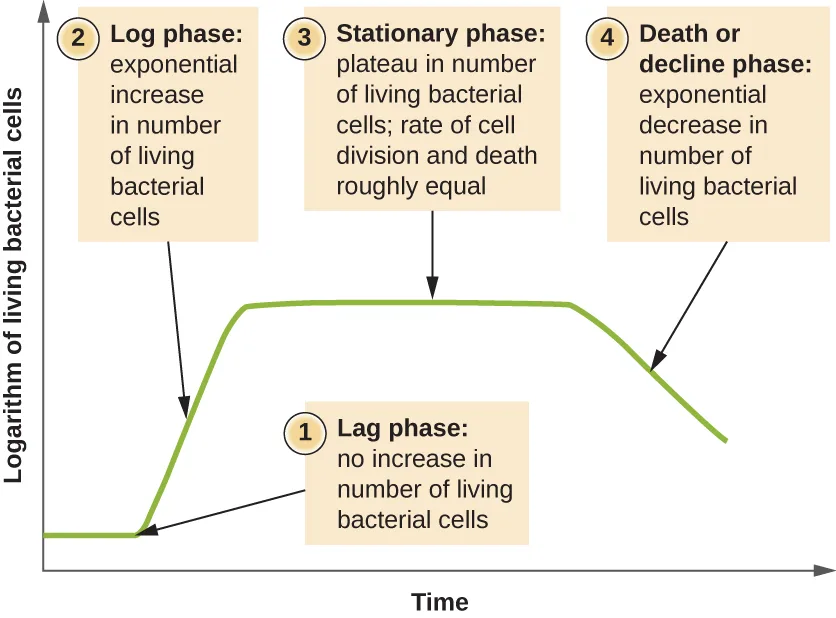
Extended description
Reading left to right along the curve: the line starts low and flat, labeled (1) lag phase: no increase in the number of living bacterial cells. It then rises steeply, labeled (2) log phase: exponential increase in the number of living bacterial cells. It then flattens into a plateau, labeled (3) stationary phase: plateau in the number of living bacterial cells, with the rate of cell division and death roughly equal. It then slopes downward, labeled (4) death or decline phase: exponential decrease in the number of living bacterial cells.
The Lag Phase
The beginning of the growth curve represents a small number of cells, referred to as an inoculum, that are added to a fresh culture medium, a nutritional broth that supports growth. The initial phase of the growth curve is called the lag phase, during which cells are gearing up for the next phase of growth. The number of cells does not change during the lag phase; however, cells grow larger and are metabolically active, synthesizing proteins needed to grow within the medium. If any cells were damaged or shocked during the transfer to the new medium, repair takes place during the lag phase. The duration of the lag phase is determined by many factors, including the species and genetic make-up of the cells, the composition of the medium, and the size of the original inoculum.
The Log Phase
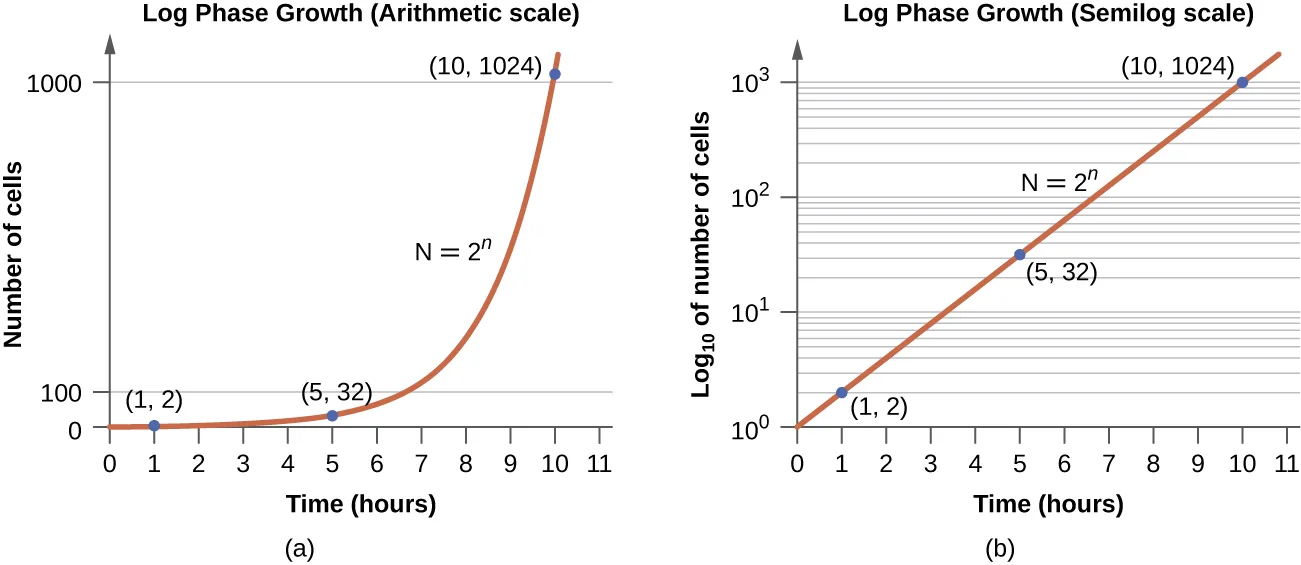
In the logarithmic (log) growth phase, sometimes called exponential growth phase, the cells are actively dividing by binary fission and their number increases exponentially. For any given bacterial species, the generation time under specific growth conditions (nutrients, temperature, pH, and so forth) is genetically determined, and this generation time is called the intrinsic growth rate. During the log phase, the relationship between time and number of cells is not linear but exponential; however, the growth curve is often plotted on a semilogarithmic graph, shown below, which gives the appearance of a linear relationship.
Extended description
(a) The arithmetic-scale graph plots number of cells against time in hours; the curve passes through (1, 2), (5, 32), and (10, 1,024), staying close to the horizontal axis until about hour 7 and then rising steeply to the last point. (b) The semilogarithmic-scale graph plots log₁₀ of number of cells against time in hours, using a logarithmic y-axis; the same three points, (1, 2), (5, 32), and (10, 1,024), fall on a single straight diagonal line from lower left to upper right. Both graphs are labeled with the equation N = 2ⁿ.
Cells in the log phase show constant growth rate and uniform metabolic activity. For this reason, cells in the log phase are preferentially used for industrial applications and research work. The log phase is also the stage where bacteria are the most susceptible to the action of disinfectants and common antibiotics that affect protein, DNA, and cell-wall synthesis.
Stationary Phase
As the number of cells increases through the log phase, several factors contribute to a slowing of the growth rate. Waste products accumulate and nutrients are gradually used up. In addition, gradual depletion of oxygen begins to limit aerobic cell growth. This combination of unfavorable conditions slows and finally stalls population growth. The total number of live cells reaches a plateau referred to as the stationary phase. In this phase, the number of new cells created by cell division is now equivalent to the number of cells dying; thus, the total population of living cells is relatively stagnant. The culture density in a stationary culture is constant. The culture’s carrying capacity, or maximum culture density, depends on the types of microorganisms in the culture and the specific conditions of the culture; however, carrying capacity is constant for a given organism grown under the same conditions.
During the stationary phase, cells switch to a survival mode of metabolism. As growth slows, so too does the synthesis of peptidoglycans, proteins, and nucleic-acids; thus, stationary cultures are less susceptible to antibiotics that disrupt these processes. In bacteria capable of producing endospores, many cells undergo sporulation during the stationary phase. Secondary metabolites, including antibiotics, are synthesized in the stationary phase. In certain pathogenic bacteria, the stationary phase is also associated with the expression of virulence factors, products that contribute to a microbe’s ability to survive, reproduce, and cause disease in a host organism. For example, quorum sensing in Staphylococcus aureus initiates the production of enzymes that can break down human tissue and cellular debris, clearing the way for bacteria to spread to new tissue where nutrients are more plentiful.
The Death Phase
As a culture medium accumulates toxic waste and nutrients are exhausted, cells die in greater and greater numbers. Soon, the number of dying cells exceeds the number of dividing cells, leading to an exponential decrease in the number of cells. This is the aptly named death phase, sometimes called the decline phase. Many cells lyse and release nutrients into the medium, allowing surviving cells to maintain viability and form endospores. A few cells, the so-called persisters, are characterized by a slow metabolic rate. Persister cells are medically important because they are associated with certain chronic infections, such as tuberculosis, that do not respond to antibiotic treatment.
Sustaining Microbial Growth
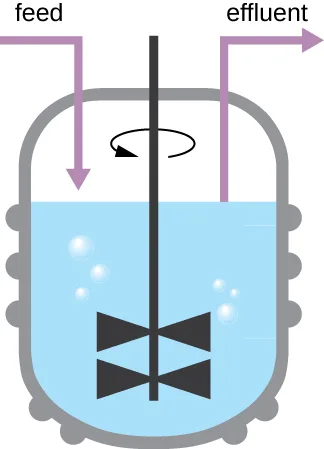
The growth pattern shown above takes place in a closed environment; nutrients are not added and waste and dead cells are not removed. In many cases, though, it is advantageous to maintain cells in the logarithmic phase of growth. One example is in industries that harvest microbial products. A chemostat, shown below, is used to maintain a continuous culture in which nutrients are supplied at a steady rate. A controlled amount of air is mixed in for aerobic processes. Bacterial suspension is removed at the same rate as nutrients flow in to maintain an optimal growth environment.
Extended description
An arrow labeled feed enters the top left of the vat and points down into the fluid; an arrow labeled effluent leaves the top right of the vat pointing away. A vertical shaft runs down the center of the vat to a two-bladed impeller near the bottom, with a curved arrow above it indicating rotation, and small bubbles are drawn near the impeller.
Check Your Understanding
During which phase does growth occur at the fastest rate?
Recall which phase is defined by exponential increase in cell number.Name two factors that limit microbial growth.
Show model answer
Did your answer mention:
Measurement of Bacterial Growth
Estimating the number of bacterial cells in a sample, known as a bacterial count, is a common task performed by microbiologists. The number of bacteria in a clinical sample serves as an indication of the extent of an infection. Quality control of drinking water, food, medication, and even cosmetics relies on estimates of bacterial counts to detect contamination and prevent the spread of disease. Two major approaches are used to measure cell number. The direct methods involve counting cells, whereas the indirect methods depend on the measurement of cell presence or activity without actually counting individual cells. Both direct and indirect methods have advantages and disadvantages for specific applications.
Direct Cell Count
Direct cell count refers to counting the cells in a liquid culture or colonies on a plate. It is a direct way of estimating how many organisms are present in a sample. Let’s look first at a simple and fast method that requires only a specialized slide and a compound microscope.
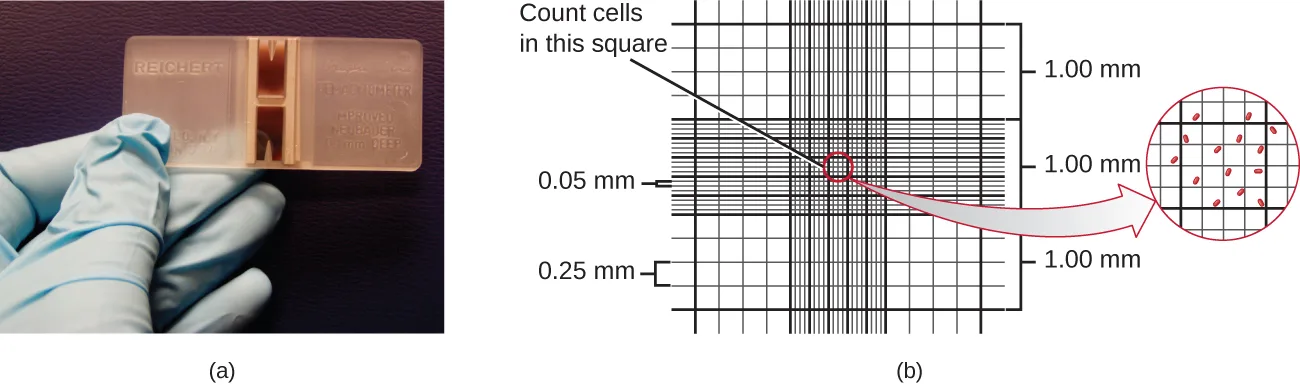
The simplest way to count bacteria is called the direct microscopic cell count, which involves transferring a known volume of a culture to a calibrated slide and counting the cells under a light microscope. The calibrated slide is called a Petroff-Hausser chamber, shown below, and is similar to a hemocytometer used to count red blood cells. The central area of the counting chamber is etched into squares of various sizes. A sample of the culture suspension is added to the chamber under a coverslip that is placed at a specific height from the surface of the grid. It is possible to estimate the concentration of cells in the original sample by counting individual cells in a number of squares and determining the volume of the sample observed. The area of the squares and the height at which the coverslip is positioned are specified for the chamber. The concentration must be corrected for dilution if the sample was diluted before enumeration.
Extended description
Panel (b)’s magnified circle shows the bold-outlined square used for counting, subdivided by fine gridlines into a 4×4 array of smaller squares. Ten red oval cells lie inside the bold square’s border; four more cells are visible just outside it, in the neighboring squares shown for context, and are not part of the count.
Cells in several small squares must be counted and the average taken to obtain a reliable measurement. The advantages of the chamber are that the method is easy to use, relatively fast, and inexpensive. On the downside, the counting chamber does not work well with dilute cultures because there may not be enough cells to count.
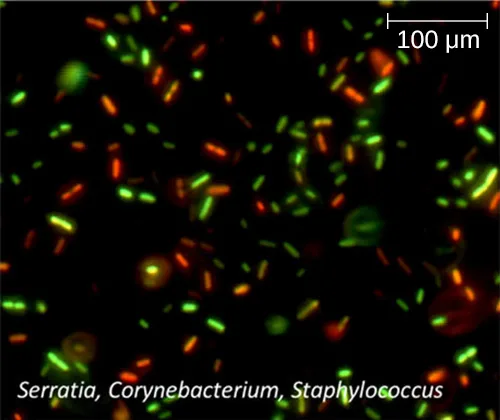
Using a counting chamber does not necessarily yield an accurate count of the number of live cells because it is not always possible to distinguish between live cells, dead cells, and debris of the same size under the microscope. However, newly developed fluorescence staining techniques make it possible to distinguish viable and dead bacteria. These viability stains (or live stains) bind to nucleic acids, but the primary and secondary stains differ in their ability to cross the cytoplasmic membrane. The primary stain, which fluoresces green, can penetrate intact cytoplasmic membranes, staining both live and dead cells. The secondary stain, which fluoresces red, can stain a cell only if the cytoplasmic membrane is considerably damaged. Thus, live cells fluoresce green because they only absorb the green stain, whereas dead cells appear red because the red stain displaces the green stain on their nucleic acids, shown below.
Another technique uses an electronic cell counting device (Coulter counter) to detect and count the changes in electrical resistance in a saline solution. A glass tube with a small opening is immersed in an electrolyte solution. A first electrode is suspended in the glass tube. A second electrode is located outside of the tube. As cells are drawn through the small aperture in the glass tube, they briefly change the resistance measured between the two electrodes and the change is recorded by an electronic sensor, shown below; each resistance change represents a cell. The method is rapid and accurate within a range of concentrations; however, if the culture is too concentrated, more than one cell may pass through the aperture at any given time and skew the results. This method also does not differentiate between live and dead cells.
Direct counts provide an estimate of the total number of cells in a sample. However, in many situations, it is important to know the number of live, or viable, cells. Counts of live cells are needed when assessing the extent of an infection, the effectiveness of antimicrobial compounds and medication, or contamination of food and water.
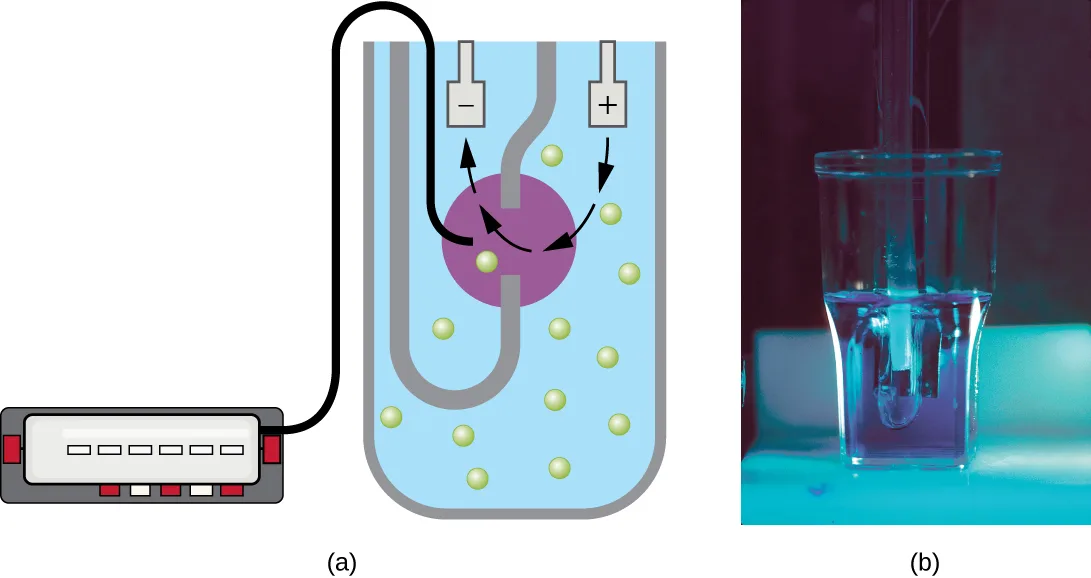
Extended description
In panel (a), the outer beaker holds the cell suspension, shown as scattered green dots. A U-shaped tube dips into the beaker and rises back out; a small aperture near the bottom of the tube’s inner leg is marked by a purple circle. Curved arrows show cells being drawn from the beaker, through the aperture, and up into the tube. A lead marked − sits inside the tube above the aperture and a lead marked + sits in the outer beaker; both wires run to an electronic counter box with a numeric display and control buttons.
Check Your Understanding
Why would you count the number of cells in more than one square in the Petroff-Hausser chamber to estimate cell numbers?
Recall what the module says must be done with counts from several squares before they yield a reliable measurement.In the viability staining method, why do dead cells appear red?
Show model answer
Did your answer mention:
Plate Count
The viable plate count, or simply plate count, is a count of viable or live cells. It is based on the principle that viable cells replicate and give rise to visible colonies when incubated under suitable conditions for the specimen. The results are usually expressed as colony-forming units per milliliter (CFU/mL) rather than cells per milliliter because more than one cell may have landed on the same spot to give rise to a single colony. Furthermore, samples of bacteria that grow in clusters or chains are difficult to disperse and a single colony may represent several cells. Some cells are described as viable but nonculturable and will not form colonies on solid media. For all these reasons, the viable plate count is considered a low estimate of the actual number of live cells. These limitations do not detract from the usefulness of the method, which provides estimates of live bacterial numbers.
Microbiologists typically count plates with 30–300 colonies. Samples with too few colonies (<30) do not give statistically reliable numbers, and overcrowded plates (>300 colonies) make it difficult to accurately count individual colonies. Also, counts in this range minimize occurrences of more than one bacterial cell forming a single colony. Thus, the calculated CFU is closer to the true number of live bacteria in the population.
There are two common approaches to inoculating plates for viable counts: the pour plate and the spread plate methods. Although the final inoculation procedure differs between these two methods, they both start with a serial dilution of the culture.
Serial Dilution
The serial dilution of a culture is an important first step before proceeding to either the pour plate or spread plate method. The goal of the serial dilution process is to obtain plates with CFUs in the range of 30–300, and the process usually involves several dilutions in multiples of 10 to simplify calculation. The number of serial dilutions is chosen according to a preliminary estimate of the culture density. The diagram below illustrates the serial dilution method.
A fixed volume of the original culture, 1.0 mL, is added to and thoroughly mixed with the first dilution tube solution, which contains 9.0 mL of sterile broth. This step represents a dilution factor of 10, or 1:10, compared with the original culture. From this first dilution, the same volume, 1.0 mL, is withdrawn and mixed with a fresh tube of 9.0 mL of dilution solution. The dilution factor is now 1:100 compared with the original culture. This process continues until a series of dilutions is produced that will bracket the desired cell concentration for accurate counting. From each tube, a sample is plated on solid medium using either the pour plate method or the spread plate method, shown below. The plates are incubated until colonies appear. Two to three plates are usually prepared from each dilution and the numbers of colonies counted on each plate are averaged. In all cases, thorough mixing of samples with the dilution medium (to ensure the cell distribution in the tube is random) is paramount to obtaining reliable results.
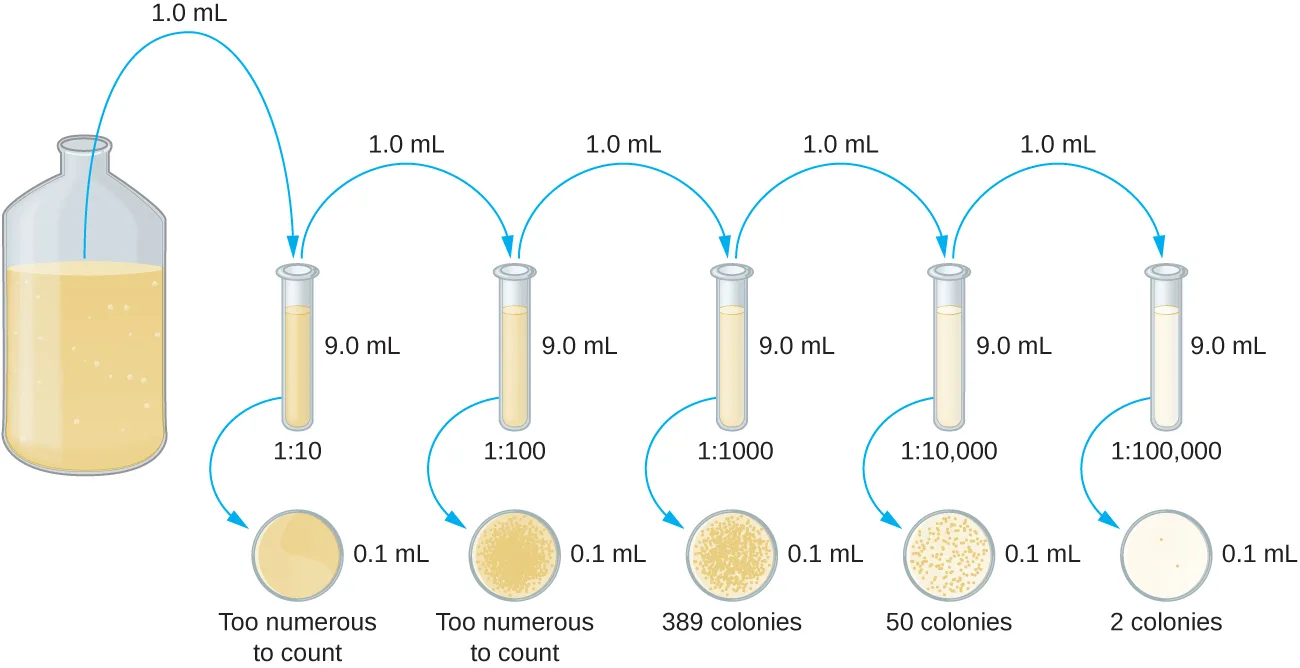
Extended description
A bottle of dark culture is diluted 1.0 mL into 9.0 mL of broth across five successive tubes, each transfer taking 1.0 mL from the previous tube, producing dilutions of 1:10, 1:100, 1:1,000, 1:10,000, and 1:100,000; each tube is visibly lighter in color than the one before it. A 0.1 mL sample from each tube is spread on its own plate: the 1:10 and 1:100 plates are too numerous to count, the 1:1,000 plate shows 389 colonies, the 1:10,000 plate shows 50 colonies, and the 1:100,000 plate shows 2 colonies.
The dilution factor is used to calculate the number of cells in the original cell culture. In our example, an average of 50 colonies was counted on the plates obtained from the 1:10,000 dilution. Because only 0.1 mL of suspension was pipetted on the plate, the multiplier required to reconstitute the original concentration is 10 × 10,000. The number of CFU per mL is equal to 50 × 10 × 10,000 = 5,000,000. The number of bacteria in the culture is estimated as 5 million cells/mL. The colony count obtained from the 1:1,000 dilution was 389, well below the expected 500 for a 10-fold difference in dilutions. This highlights the issue of inaccuracy when colony counts are greater than 300 and more than one bacterial cell grows into a single colony.
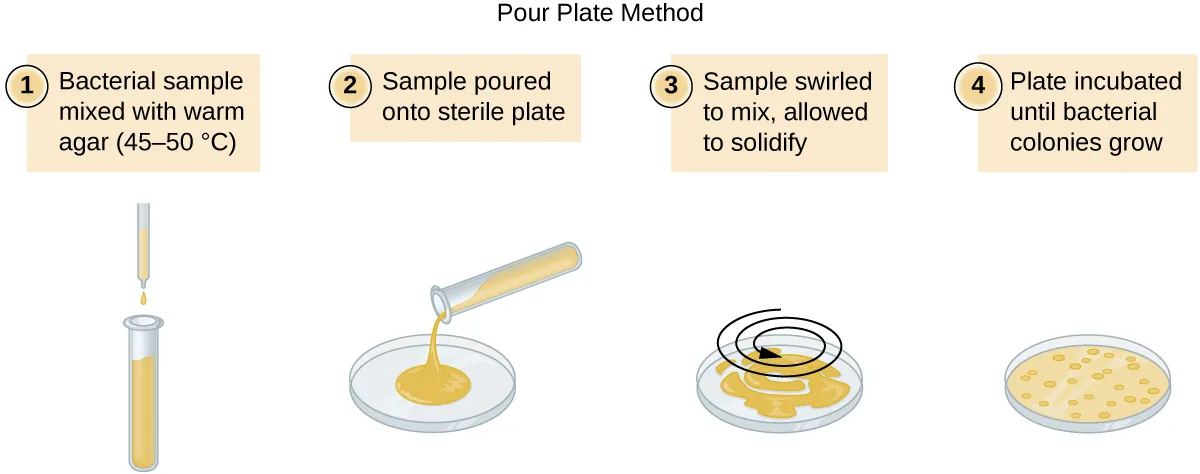
Extended description
Step 1: a bacterial sample from a test tube is mixed with warm agar (45–50 °C). Step 2: the mixed sample is poured into an empty sterile Petri dish. Step 3: the dish is swirled to mix and left to solidify. Step 4: the solidified plate is incubated, shown with scattered round colonies growing across its surface.
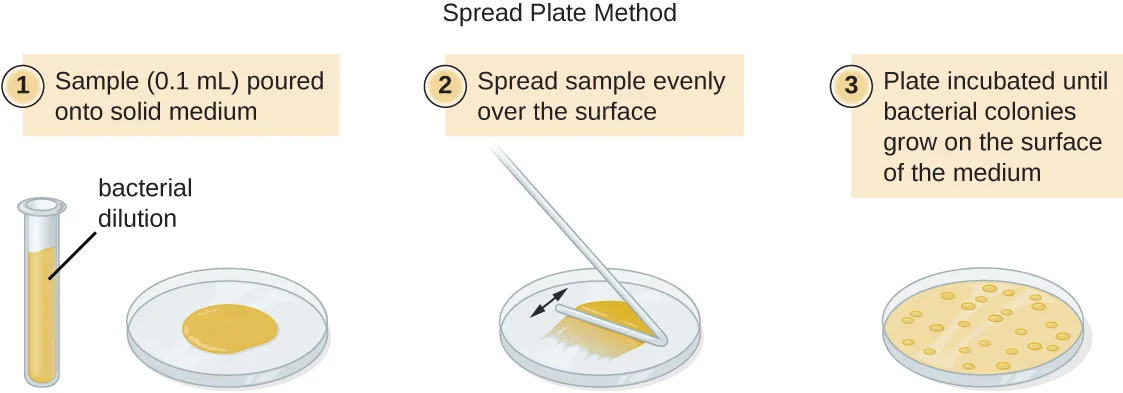
Extended description
Step 1: 0.1 mL of a bacterial dilution, labeled bacterial dilution, is poured from a test tube onto a plate of solid medium. Step 2: a bent glass spreader moves back and forth across the plate’s surface to spread the sample evenly, shown by a double-headed arrow. Step 3: the incubated plate shows round colonies scattered across the surface of the medium.
A very dilute sample—drinking water, for example—may not contain enough organisms to use either of the plate count methods described. In such cases, the original sample must be concentrated rather than diluted before plating. This can be accomplished using a modification of the plate count technique called the membrane filtration technique. Known volumes are vacuum-filtered aseptically through a membrane with a pore size small enough to trap microorganisms. The membrane is transferred to a Petri plate containing an appropriate growth medium. Colonies are counted after incubation. Calculation of the cell density is made by dividing the cell count by the volume of filtered liquid.
Link to Learning
Watch this video for demonstrations of serial dilutions and spread plate techniques.
The Most Probable Number
The number of microorganisms in dilute samples is usually too low to be detected by the plate count methods described thus far. For these specimens, microbiologists routinely use the most probable number (MPN) method, a statistical procedure for estimating of the number of viable microorganisms in a sample. Often used for water and food samples, the MPN method evaluates detectable growth by observing changes in turbidity or color due to metabolic activity.
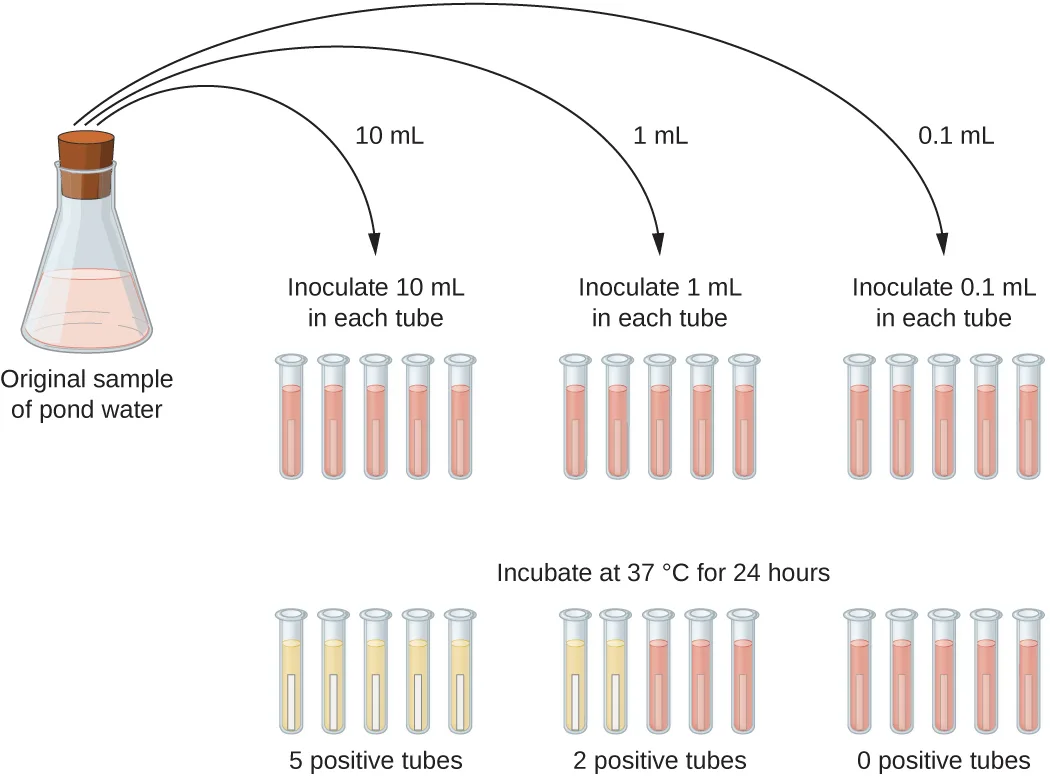
A typical application of MPN method is the estimation of the number of coliforms in a sample of pond water. Coliforms are gram-negative rod bacteria that ferment lactose. The presence of coliforms in water is considered a sign of contamination by fecal matter. For the method illustrated below, a series of three dilutions of the water sample is tested by inoculating five lactose broth tubes with 10 mL of sample, five lactose broth tubes with 1 mL of sample, and five lactose broth tubes with 0.1 mL of sample. The lactose broth tubes contain a pH indicator that changes color from red to yellow when the lactose is fermented. After inoculation and incubation, the tubes are examined for an indication of coliform growth by a color change in media from red to yellow. The first set of tubes (10-mL sample) showed growth in all the tubes; the second set of tubes (1 mL) showed growth in two tubes out of five; in the third set of tubes, no growth is observed in any of the tubes (0.1-mL dilution). The numbers 5, 2, and 0 are compared with Figure B1 in Appendix B, which has been constructed using a probability model of the sampling procedure. From our reading of the table, we conclude that 49 is the most probable number of bacteria per 100 mL of pond water.
Extended description
An Erlenmeyer flask of pond water is used to inoculate three sets of five tubes: the first five tubes each receive 10 mL of sample, the next five each receive 1 mL, and the last five each receive 0.1 mL; all tubes start out the same pink color. After incubation at 37 °C for 24 hours, all 5 of the 10-mL tubes have turned yellow (positive), 2 of the 5 1-mL tubes have turned yellow while 3 remain pink, and all 5 of the 0.1-mL tubes remain pink (0 positive).
Check Your Understanding
What is a colony-forming unit?
Recall why the plate-count results are expressed as colony-forming units per milliliter rather than cells per milliliter.What two methods are frequently used to estimate bacterial numbers in water samples?
Show model answer
Did your answer mention:
Indirect Cell Counts
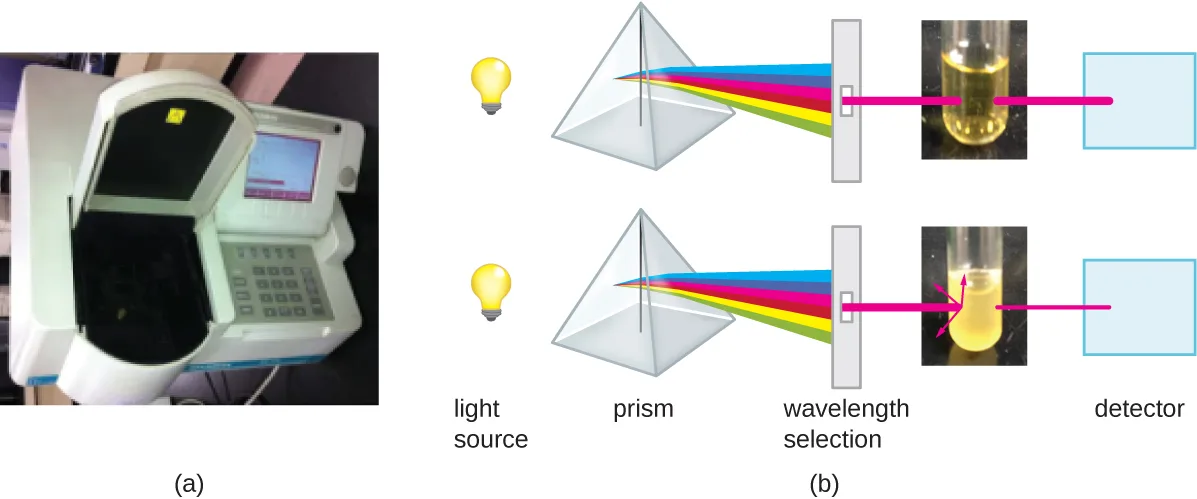
Besides direct methods of counting cells, other methods, based on an indirect detection of cell density, are commonly used to estimate and compare cell densities in a culture. The foremost approach is to measure the turbidity (cloudiness) of a sample of bacteria in a liquid suspension. The laboratory instrument used to measure turbidity is called a spectrophotometer, shown below. In a spectrophotometer, a light beam is transmitted through a bacterial suspension, the light passing through the suspension is measured by a detector, and the amount of light passing through the sample and reaching the detector is converted to either percent transmission or a logarithmic value called absorbance (optical density). As the numbers of bacteria in a suspension increase, the turbidity also increases and causes less light to reach the detector. The decrease in light passing through the sample and reaching the detector is associated with a decrease in percent transmission and increase in absorbance measured by the spectrophotometer.
Measuring turbidity is a fast method to estimate cell density as long as there are enough cells in a sample to produce turbidity. It is possible to correlate turbidity readings to the actual number of cells by performing a viable plate count of samples taken from cultures having a range of absorbance values. Using these values, a calibration curve is generated by plotting turbidity as a function of cell density. Once the calibration curve has been produced, it can be used to estimate cell counts for all samples obtained or cultured under similar conditions and with densities within the range of values used to construct the curve.
Extended description
In panel (b), a light bulb shines into a triangular prism, which splits the light into a rainbow-colored fan; a wavelength-selection slit picks out one color. In the top row, this single-wavelength beam passes through a tube of clear yellow broth largely undiminished and reaches a detector box at full width. In the bottom row, the same beam passes through a tube of more turbid yellow broth, where arrows show the beam scattering inside the tube, and only a narrower beam continues on to the detector.
Measuring dry weight of a culture sample is another indirect method of evaluating culture density without directly measuring cell counts. The cell suspension used for weighing must be concentrated by filtration or centrifugation, washed, and then dried before the measurements are taken. The degree of drying must be standardized to account for residual water content. This method is especially useful for filamentous microorganisms, which are difficult to enumerate by direct or viable plate count.
As we have seen, methods to estimate viable cell numbers can be labor intensive and take time because cells must be grown. Recently, indirect ways of measuring live cells have been developed that are both fast and easy to implement. These methods measure cell activity by following the production of metabolic products or disappearance of reactants. Adenosine triphosphate (ATP) formation, biosynthesis of proteins and nucleic acids, and consumption of oxygen can all be monitored to estimate the number of cells.
Check Your Understanding
What is the purpose of a calibration curve when estimating cell count from turbidity measurements?
Recall what the calibration curve plots and what it is then used to do for samples of similar conditions and density range.What are the newer indirect methods of counting live cells?
Show model answer
Did your answer mention:
Alternative Patterns of Cell Division
Binary fission is the most common pattern of cell division in prokaryotes, but it is not the only one. Other mechanisms usually involve asymmetrical division (as in budding) or production of spores in aerial filaments.
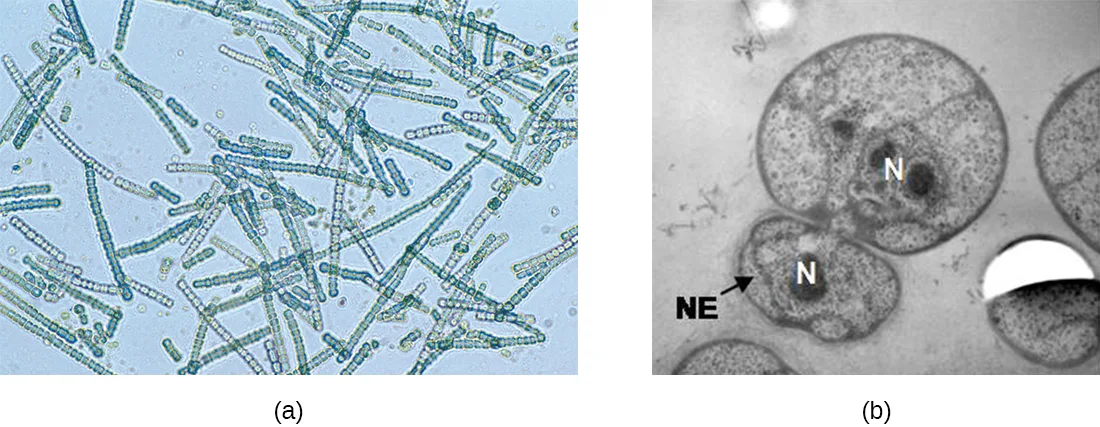
In some cyanobacteria, many nucleoids may accumulate in an enlarged round cell or along a filament, leading to the generation of many new cells at once. The new cells often split from the parent filament and float away in a process called fragmentation, shown below. Fragmentation is commonly observed in the Actinomycetes, a group of gram-positive bacteria commonly found in soil. (Source note: the source calls the Actinomycetes “gram-positive, anaerobic bacteria”; the book’s own table of Actinobacteria in the section on gram-positive bacteria classifies the genus Actinomyces as facultative anaerobes, so this page omits the respiration descriptor.) Another curious example of cell division in prokaryotes, reminiscent of live birth in animals, is exhibited by the giant bacterium Epulopiscium. Several daughter cells grow fully in the parent cell, which eventually disintegrates, releasing the new cells to the environment. Other species may form a long narrow extension at one pole in a process called budding. The tip of the extension swells and forms a smaller cell, the bud that eventually detaches from the parent cell. Budding is most common in yeast, shown in the micrograph below, but it is also observed in prosthecate bacteria and some cyanobacteria.
Extended description
Panel (b) shows a large mother cell and a smaller budding cell attached to it, plus additional partial cells at the image edges. Inside the mother cell, a dark, irregular internal region is labeled N (nucleoid). The smaller attached cell also has a dark internal region labeled N, and an arrow labeled NE points to a lighter region beside it, identifying the still-forming nuclear envelope.
The soil bacteria Actinomyces grow in long filaments divided by septa, similar to the mycelia seen in fungi, resulting in long cells with multiple nucleoids. Environmental signals, probably related to low nutrient availability, lead to the formation of aerial filaments. Within these aerial filaments, elongated cells divide simultaneously. The new cells, which contain a single nucleoid, develop into spores that give rise to new colonies.
Check Your Understanding
Identify at least one difference between fragmentation and budding.
Show model answer
Did your answer mention:
Biofilms
In nature, microorganisms grow mainly in biofilms, complex and dynamic ecosystems that form on a variety of environmental surfaces, from industrial conduits and water treatment pipelines to rocks in river beds. Biofilms are not restricted to solid surface substrates, however. Almost any surface in a liquid environment containing some minimal nutrients will eventually develop a biofilm. Microbial mats that float on water, for example, are biofilms that contain large populations of photosynthetic microorganisms. Biofilms found in the human mouth may contain hundreds of bacterial species. Regardless of the environment where they occur, biofilms are not random collections of microorganisms; rather, they are highly structured communities that provide a selective advantage to their constituent microorganisms.
Biofilm Structure
Observations using confocal microscopy have shown that environmental conditions influence the overall structure of biofilms. Filamentous biofilms called streamers form in rapidly flowing water, such as freshwater streams, eddies, and specially designed laboratory flow cells that replicate growth conditions in fast-moving fluids. The streamers are anchored to the substrate by a “head” and the “tail” floats downstream in the current. In still or slow-moving water, biofilms mainly assume a mushroom-like shape. The structure of biofilms may also change with other environmental conditions such as nutrient availability.
Detailed observations of biofilms under confocal laser and scanning electron microscopes reveal clusters of microorganisms embedded in a matrix interspersed with open water channels. The extracellular matrix consists of extracellular polymeric substances (EPS) secreted by the organisms in the biofilm. The extracellular matrix represents a large fraction of the biofilm, accounting for 50%–90% of the total dry mass. The properties of the EPS vary according to the resident organisms and environmental conditions.
EPS is a hydrated gel composed primarily of polysaccharides and containing other macromolecules such as proteins, nucleic acids, and lipids. It plays a key role in maintaining the integrity and function of the biofilm. Channels in the EPS allow movement of nutrients, waste, and gases throughout the biofilm. This keeps the cells hydrated, preventing desiccation. EPS also shelters organisms in the biofilm from predation by other microbes or cells (e.g., protozoans, white blood cells in the human body).
Biofilm Formation
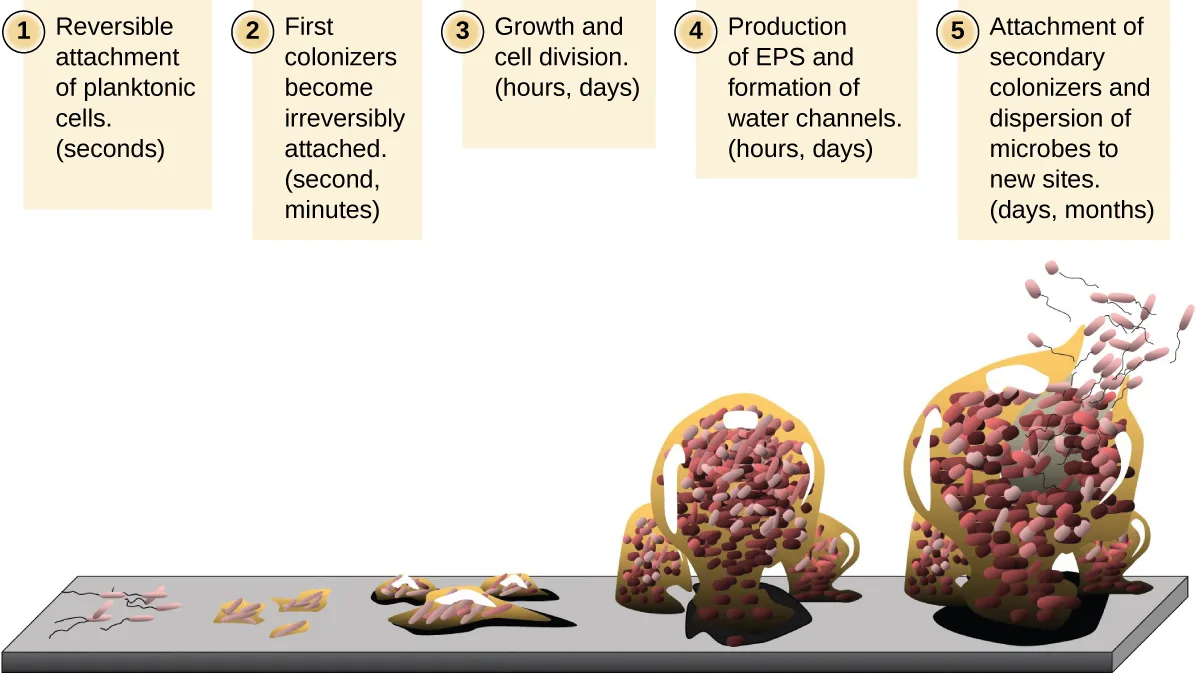
Free-floating microbial cells that live in an aquatic environment are called planktonic cells. The formation of a biofilm essentially involves the attachment of planktonic cells to a substrate, where they become sessile (attached to a surface). This occurs in stages, as depicted below. The first stage involves the attachment of planktonic cells to a surface coated with a conditioning film of organic material. At this point, attachment to the substrate is reversible, but as cells express new phenotypes that facilitate the formation of EPS, they transition from a planktonic to a sessile lifestyle. The biofilm develops characteristic structures, including an extensive matrix and water channels. Appendages such as fimbriae, pili, and flagella interact with the EPS, and microscopy and genetic analysis suggest that such structures are required for the establishment of a mature biofilm. In the last stage of the biofilm life cycle, cells on the periphery of the biofilm revert to a planktonic lifestyle, sloughing off the mature biofilm to colonize new sites. This stage is referred to as dispersal.
Extended description
Stage 1, reversible attachment (seconds): a few flagellated cells sit loosely on the surface. Stage 2, irreversible attachment (seconds to minutes): small clusters of cells are attached to the surface. Stage 3, growth and cell division (hours, days): larger clusters cover more of the surface. Stage 4, production of EPS and formation of water channels (hours, days): very large mushroom-shaped clusters with visible internal openings. Stage 5, attachment of secondary colonizers and dispersion of microbes to new sites (days, months): from the large mature cluster, small flagellated cells are shown detaching and swimming away.
Within a biofilm, different species of microorganisms establish metabolic collaborations in which the waste product of one organism becomes the nutrient for another. For example, aerobic microorganisms consume oxygen, creating anaerobic regions that promote the growth of anaerobes. This occurs in many polymicrobial infections that involve both aerobic and anaerobic pathogens.
The mechanism by which cells in a biofilm coordinate their activities in response to environmental stimuli is called quorum sensing. Quorum sensing—which can occur between cells of different species within a biofilm—enables microorganisms to detect their cell density through the release and binding of small, diffusible molecules called autoinducers. When the cell population reaches a critical threshold (a quorum), these autoinducers initiate a cascade of reactions that activate genes associated with cellular functions that are beneficial only when the population reaches a critical density. For example, in some pathogens, synthesis of virulence factors only begins when enough cells are present to overwhelm the immune defenses of the host. Although mostly studied in bacterial populations, quorum sensing takes place between bacteria and eukaryotes and between eukaryotic cells such as the fungus Candida albicans, a common member of the human microbiota that can cause infections in immunocompromised individuals.
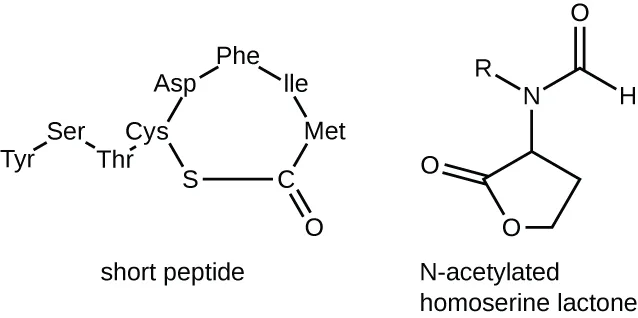
The signaling molecules in quorum sensing belong to two major classes. Gram-negative bacteria communicate mainly using N-acylated homoserine lactones, whereas gram-positive bacteria mostly use small peptides, shown below. In all cases, the first step in quorum sensing consists of the binding of the autoinducer to its specific receptor only when a threshold concentration of signaling molecules is reached. Once binding to the receptor takes place, a cascade of signaling events leads to changes in gene expression. The result is the activation of biological responses linked to quorum sensing, notably an increase in the production of signaling molecules themselves, hence the term autoinducer.
Extended description
The left structure, labeled short peptide, is a chain of amino acids reading Tyr-Ser-Thr-Cys, with the Cys side chain’s sulfur bonded into a ring that continues Cys-Asp-Phe-Ile-Met, closing back to a carbonyl carbon (a carbon with a double-bonded oxygen) bonded to the sulfur. The right structure, labeled N-acetylated homoserine lactone, is a five-membered ring holding one ring oxygen and a ketone (C=O) in the ring; a nitrogen outside the ring is attached to the ring carbon and carries an R group on one side and, on the other, a carbon bonded to a double-bonded oxygen and a hydrogen.
Biofilms and Human Health
The human body harbors many types of biofilms, some beneficial and some harmful. For example, the layers of normal microbiota lining the intestinal and respiratory mucosa play a role in warding off infections by pathogens. However, other biofilms in the body can have a detrimental effect on health. For example, the plaque that forms on teeth is a biofilm that can contribute to dental and periodontal disease. Biofilms can also form in wounds, sometimes causing serious infections that can spread. The bacterium Pseudomonas aeruginosa often colonizes biofilms in the airways of patients with cystic fibrosis, causing chronic and sometimes fatal infections of the lungs. Biofilms can also form on medical devices used in or on the body, causing infections in patients with in-dwelling catheters, artificial joints, or contact lenses.
Pathogens embedded within biofilms exhibit a higher resistance to antibiotics than their free-floating counterparts. Several hypotheses have been proposed to explain why. Cells in the deep layers of a biofilm are metabolically inactive and may be less susceptible to the action of antibiotics that disrupt metabolic activities. The EPS may also slow the diffusion of antibiotics and antiseptics, preventing them from reaching cells in the deeper layers of the biofilm. Phenotypic changes may also contribute to the increased resistance exhibited by bacterial cells in biofilms. For example, the increased production of efflux pumps, membrane-embedded proteins that actively extrude antibiotics out of bacterial cells, have been shown to be an important mechanism of antibiotic resistance among biofilm-associated bacteria. Finally, biofilms provide an ideal environment for the exchange of extrachromosomal DNA, which often includes genes that confer antibiotic resistance.
Biofilms forming on equipment such as filtration systems can compromise their performance and cause health risks. Components of CPAP (continuous positive airway pressure) machines, which are used to help people with sleep apnea, must be replaced periodically because of biofilm buildup. On the International Space Station, biofilms clog hoses and other portions of water reclamation and filtration systems—critical elements to long-term survival in space. After years of effort, a 2023 discovery has significant implications for space travel and dwelling.
Previous approaches to prevent biofilm build-up included treating surfaces with anti-bacterial substances. But researchers Pamela Flores at University of Colorado and Samantha McBride of MIT described in a 2023 paper, these often failed when a layer of dead biofilm cells forms and becomes an anchor point for subsequent biofilms to grow. Furthermore, rapid microbial adaptation leads to resistant strains, which may lead to even greater risks for crew and equipment. So, instead of killing microorganisms, McBride and Flores—working with Kripa Varanasi (MIT), Luis Zea (U. of Colorado), and Jonathan Galazko (NASA)—treated surfaces with a layer of lubricant, which was infused into the tiny crevices of the surface and held there by capillary action. Experiments on Earth and on the ISS showed that the lubrication was effective at preventing biofilm growth because it eliminated microorganism adhesion. Beyond space exploration applications, the approach may be used in medical and other devices. (Flores, P., McBride, S.A., Galazka, J.M. et al. (2023). Biofilm formation of Pseudomonas aeruginosa in spaceflight is minimized on lubricant impregnated surfaces. Nature Microgravity 9, 66.)
Check Your Understanding
What is the matrix of a biofilm composed of?
Name the hydrated-gel substance secreted by the biofilm’s organisms whose channels keep the biofilm hydrated and that shelters its cells from predation.What is the role of quorum sensing in a biofilm?
Recall the sentence that defines quorum sensing itself, distinct from attachment, EPS’s protective role, or gene exchange.Summary
- Most bacterial cells divide by binary fission. Generation time in bacterial growth is defined as the doubling time of the population.
- Cells in a closed system follow a pattern of growth with four phases: lag, logarithmic (exponential), stationary, and death.
- Cells can be counted by direct viable cell count. The pour plate and spread plate methods are used to plate serial dilutions into or onto, respectively, agar to allow counting of viable cells that give rise to colony-forming units. Membrane filtration is used to count live cells in dilute solutions. The most probable cell number (MPN) method allows estimation of cell numbers in cultures without using solid media.
- Indirect methods can be used to estimate culture density by measuring turbidity of a culture or live cell density by measuring metabolic activity.
- Other patterns of cell division include multiple nucleoid formation in cells; asymmetric division, as in budding; and the formation of hyphae and terminal spores.
- Biofilms are communities of microorganisms enmeshed in a matrix of extracellular polymeric substance. The formation of a biofilm occurs when planktonic cells attach to a substrate and become sessile. Cells in biofilms coordinate their activity by communicating through quorum sensing.
- Biofilms are commonly found on surfaces in nature and in the human body, where they may be beneficial or cause severe infections. Pathogens associated with biofilms are often more resistant to antibiotics and disinfectants.
Key terms
- binary fission — predominant form of bacterial reproduction in which one cell divides into two daughter cells of equal size, which separate, each offspring receiving a complete copy of the parental genome.
- septum — separating structure that forms during cell division; also describes the separating wall between cells in a filament.
- generation time — see doubling time.
- doubling time — the time it takes for the population to double; also referred to as generation time.
- growth curve — a graph modeling the number of cells in a culture over time.
- culture density — the number of cells per volume of broth.
- inoculum — small number of cells added to medium to start a culture.
- culture medium — combination of compounds in solution that supports growth.
- lag phase — interval before exponential growth of a microbial population during which cells adjust to a new environment.
- logarithmic (log) growth phase — interval of growth when cells divide exponentially; also known as the exponential growth phase.
- intrinsic growth rate — genetically determined generation time under specific conditions for a bacterial strain.
- stationary phase — interval during which the number of cells formed by cell division is equal to the number of cells dying.
- death phase — phase of the growth curve at which the number of dying cells exceeds the number of new cells formed.
- persisters — dormant cell that survives in the death phase and is resistant to most antibiotics.
- direct microscopic cell count — counting of cells using a calibrated slide under a light microscope.
- Petroff-Hausser chamber — calibrated slide that allows counting of bacteria in a specific volume under a microscope.
- viable — describes a live cell, as distinguished from a dead cell or debris of the same size.
- viable plate count — direct method of measuring microbial growth in a culture; the number of viable or live cells is usually expressed in CFU/mL.
- colony-forming unit — a counting quantity represented by a colony formed on solid medium from a single cell or a few cells.
- serial dilution — sequential transfer of known volumes of culture samples from one tube to another to perform a several-fold dilution of the original culture.
- pour plate method — a technique used for inoculating plates with diluted bacterial samples for the purpose of cell counting; cells are mixed with warm liquid agar before being poured into Petri dishes.
- spread plate method — a technique used for inoculating plates with diluted bacterial samples for the purpose of cell counting; the liquid sample is pipetted onto solid medium and spread uniformly across the plate.
- membrane filtration technique — known volumes are vacuum filtered aseptically through a membrane with a pore size small enough to trap microorganisms, which are counted after growth on plates.
- most probable number (MPN) method — statistical value representing the viable bacterial population in a sample obtained after a series of dilutions and multiple tube inoculations.
- turbidity — cloudiness of a culture due to refraction of light by cells and particles.
- fragmentation — newly formed cells split away from the parent filament in actinomycetes and cyanobacteria.
- budding — unequal reproductive division in which a smaller cell detaches from the parent cell.
- biofilms — complex ecosystem of bacteria embedded in a matrix.
- extracellular polymeric substances (EPS) — hydrated gel secreted by bacteria in a biofilm containing polysaccharides, proteins, nucleic acids, and some lipids.
- planktonic — free-floating or drifting in suspension.
- sessile — attached to a surface.
- quorum sensing — cell-to-cell communication in bacteria; enables a coordinated response from cells when the population reaches a threshold density.
- autoinducers — signaling molecule produced by a bacterial cell that can modify the activity of surrounding cells; associated with quorum sensing.
Practice
Define the generation time for growth based on binary fission
Which of the following is the best definition of generation time in a bacterium?
Recall the term the module uses interchangeably with generation time, and what that term is defined as.What is the function of the Z ring in binary fission?
Recall what the cell-division protein assembles into, a few sentences after binary fission is introduced, and what that structure is anchored to and pinches.If a culture starts with 50 cells, how many cells will be present after five generations with no cell death?
Apply Nₙ = N₀2ⁿ with N₀ = 50 and n = 5.Identify and describe the activities of microorganisms undergoing typical phases of binary fission (simple cell division) in a growth curve
In which phase would you expect to observe the most endospores in a Bacillus cell culture?
Recall which phase the module names for the onset of sporulation, as nutrients are exhausted and toxic waste accumulates.During which phase would penicillin, an antibiotic that inhibits cell-wall synthesis, be most effective?
Recall which phase the module names as the stage where bacteria are most susceptible to antibiotics that affect cell-wall synthesis.Which growth phase matches this description: the number of dying cells is higher than the number of cells dividing?
Recall which phase is defined by dying cells outnumbering dividing cells.Which growth phase matches this description: the number of new cells is equal to the number of dying cells?
Recall which phase is defined by cell division and cell death being roughly balanced.Which growth phase matches this description: new enzymes to use available nutrients are induced?
Recall which phase involves cells gearing up metabolically, synthesizing proteins needed to grow in the new medium, before cell numbers change.Which growth phase matches this description: binary fission is occurring at maximum rate?
Recall which phase is defined by cells actively dividing and increasing exponentially.Explain several laboratory methods used to determine viable and total cell counts in populations undergoing exponential growth
Which of the following methods would be used to measure the concentration of bacterial contamination in processed peanut butter?
Recall which method gives a count of colony-forming units from a solid sample, rather than depending on a liquid suspension’s turbidity or a calibrated slide.Which pair of tools is used to perform a direct count of total cells?
Recall the two calibrated-slide devices named for counting cells directly under a light microscope, one of them used for red blood cells.The ________ method allows direct count of total cells growing on solid medium.
Name the method that counts colonies formed on solid medium, distinct from the calibrated-slide or electronic counting methods.A statistical estimate of the number of live cells in a liquid is usually done by ________.
Name the statistical procedure used for dilute water and food samples that evaluates growth by turbidity or color change across a series of tubes.For this indirect method of estimating the growth of a culture, you measure ________ using a spectrophotometer.
Name the cloudiness measurement the spectrophotometer detects as an indirect indicator of cell density.Active growth of a culture may be estimated indirectly by measuring which of the following products of cell metabolism?
Recall the two products of cell metabolism the module names as newer, fast, indirect ways of measuring live cells, alongside protein and nucleic acid biosynthesis and oxygen consumption.Why is it important to measure the transmission of light through a control tube with only broth in it when making turbidity measures of bacterial cultures?
Show model answer
Did your answer mention:
In terms of counting cells, what does a plating method accomplish that an electronic cell counting method does not?
Show model answer
Did your answer mention:
Refer to Appendix B. If the results from a pond water sample were recorded as 3, 2, 1, what would be the MPN of bacteria in 100 mL of pond water?
Show model answer
Did your answer mention:
Refer to the spectrophotometer figure above. Why does turbidity lose reliability at high cell concentrations when the culture reaches the stationary phase?
Show model answer
Did your answer mention:
Describe examples of cell division not involving binary fission, such as budding or fragmentation
Filamentous cyanobacteria often divide by which of the following?
Recall the process in which new cells split from the parent filament and float away, common in cyanobacteria and Actinomycetes.Which pattern of cell division involves a long narrow extension forming at one pole of the cell, with the tip swelling into a smaller cell that eventually detaches from the parent?
Recall the process most common in yeast that is described in contrast with fragmentation.In Actinomyces, elongated cells within ________ divide simultaneously to form spores that give rise to new colonies.
Name the structures Actinomyces forms in response to environmental signals, probably related to low nutrient availability.Describe the formation and characteristics of biofilms
Order the following stages of the development of a biofilm from the earliest to the last step: (A) secretion of EPS, (B) reversible attachment, (C) dispersal, (D) formation of water channels, (E) irreversible attachment.
Show model answer
Did your answer mention:
EPS is a hydrated gel composed primarily of ________.
Name the primary macromolecule class of the extracellular matrix, alongside the proteins, nucleic acids, and lipids it also contains.Free-floating microbial cells that live in an aquatic environment are called ________ cells.
Name the term contrasted with sessile once cells attach to a substrate and begin forming a biofilm.Identify health risks associated with biofilms and how they are addressed
Which is a reason for antimicrobial resistance being higher in a biofilm than in free-floating bacterial cells?
Recall which layer of a biofilm the module describes as metabolically inactive, and why that would make antibiotics that disrupt metabolic activities less effective.Infections among hospitalized patients are often related to the presence of a medical device in the patient. Which conditions favor the formation of biofilms on in-dwelling catheters and prostheses?
Show model answer
Did your answer mention:
A patient in the hospital has an intravenous catheter inserted to allow for the delivery of medications, fluids, and electrolytes. Four days after the catheter is inserted, the patient develops a fever and an infection in the skin around the catheter. Blood cultures reveal that the patient has a blood-borne infection. Tests in the clinical laboratory identify the blood-borne pathogen as Staphylococcus epidermidis, and antibiotic susceptibility tests are performed to provide doctors with essential information for selecting the best drug for treatment of the infection. Antibacterial chemotherapy is initiated and delivered through the intravenous catheter that was originally inserted into the patient. Within 7 days, the skin infection is gone, blood cultures are negative for S. epidermidis, and the antibacterial chemotherapy is discontinued. However, 2 days after discontinuing the antibacterial chemotherapy, the patient develops another fever and skin infection and the blood cultures are positive for the same strain of S. epidermidis that had been isolated the previous week. This time, doctors remove the intravenous catheter and administer oral antibiotics, which successfully treat both the skin and blood-borne infection caused by S. epidermidis. Furthermore, the infection does not return after discontinuing the oral antibacterial chemotherapy. What are some possible reasons why intravenous chemotherapy failed to completely cure the patient despite laboratory tests showing the bacterial strain was susceptible to the prescribed antibiotic? Why might the second round of antibiotic therapy have been more successful? Justify your answers.
Show model answer
Did your answer mention:
Describe quorum sensing and its role in cell-to-cell communication and coordination of cellular activities
Quorum sensing is used by bacterial cells to determine which of the following?
Recall what autoinducers let cells detect about their own population, once a critical threshold is reached.Which of the following statements about autoinducers is incorrect?
Recall that autoinducers act by binding a specific receptor, which then triggers a signaling cascade — they do not act on DNA directly.Why are autoinducers small molecules?
Recall the two adjectives the module uses together to describe autoinducers when quorum sensing is first defined.This section is adapted from Microbiology, Section 9.1: How Microbes Grow by Nina Parker, Mark Schneegurt, Anh-Hue Thi Tu, Philip Lister, Brian M. Forster, and OpenStax, © OpenStax, licensed under CC BY-NC-SA 4.0. Access the original for free at openstax.org. Changes: all 17 source figures re-encoded as WebP and rendered as mediafigures after image and PDF inspection, each set kind="diagram" or kind="photo" from the artwork (composite figures with any drawn panel are diagram; the binary-fission micrograph/diagram composite carries eager="true" as the page’s first figure); longdesc added for every process, graph, and structural figure (binary fission, the Z ring, the generation-time tree, the growth curve, the log-phase arithmetic/semilog pair, the chemostat, the Petroff-Hausser grid, the Coulter counter, serial dilution, the pour and spread plate methods, the MPN tubes, the spectrophotometer, biofilm formation, and the two quorum-sensing chemical structures) walking the steps, stages, or axes as drawn; the Petroff-Hausser figure’s longdesc recounts the enlarged square from the image itself (ten cells inside the bold-outlined counting square, four more visible outside it in neighboring squares shown for context), confirming rather than contradicting the caption’s stated count of ten. Source alts were rewritten throughout to describe what the WebP actually shows (the source alts were largely accurate for this module; no source-alt defect is logged). The Clinical Focus Part 1 and Micro Connection boxes and the Link to Learning are rendered as callouts in source order; the generation-time figure stays inside the Micro Connection box at its document position; the Clinical Focus box’s closing “Jump to the next Clinical Focus box” link is replaced by a sentence naming where the case continues, Oxygen Requirements for Microbial Growth; its closing question stays inside the callout as an unanswered plain bullet. The one genuine equation (Nₙ = N₀2ⁿ) is set as its own paragraph of display math, $N_n = N_0 2^n$; a variable exponent stays Unicode superscript in prose (2ⁿ), but the lint’s numeric-exponent rule (a digit followed by a superscript digit is math outside a mediafigure alt/longdesc) requires the module’s numeric exponents in body prose — $2^{48}$, $2.8 \times 10^{14}$, and the $1 \times 10^5$ starting population in the doubling-time item — to be set as math instead of the Unicode form the brief’s §0 prescribed; 0.04 mm² and 0.008 mm³ stay Unicode because a unit exponent is not preceded by a bare digit. The footnoted 2023 Nature Microgravity citation on biofilms in spaceflight is kept as an inline parenthetical citation with its DOI-less reference; the bare URL under Link to Learning is dropped in favor of a Markdown link. The 13 body Check Your Understanding bullets across 8 boxes are rendered as body items at their note’s position: 8 are graded (textin or multiplechoice) from a single fixing sentence of this module, and 5 stay selfcheck because their honest answers are an open list (“name two factors,” several defensible answers), a longer assembled list (the newer indirect methods), an open compare-and-contrast (fragmentation vs. budding), or — on checker review — need two sentences from different paragraphs rather than one (the viability-stain mechanism combines the green/red absorption sentence with the membrane-permeability sentence that explains it; the two-water-methods question needs both the membrane-filtration paragraph and the later MPN paragraph) — each self-check’s model answer and rubric are assembled only from this module’s own sentences. Of the 24 source end-of-section exercises: the 10 Multiple Choice items keep their source options, order, and key; of the 5 Fill in the Blank items, three (plate count; most probable number, accept="MPN"; turbidity) are textin, and two whose keys exceed four words (“hemocytometer, Petroff-Hausser counting chamber” and “ATP, acid from fermentation”) are rendered as multiplechoice with the source’s own comma-joined list as the key and three other module-sourced method/product pairs as distractors, per the length rule; the one Matching exercise (four growth-phase rows, keyed D, C, A, B) is rendered as four multiple-choice items, one per row, each offering all four phases in the table’s own order; of the four unkeyed Short Answer questions, all four stay self-checks — the turbidity-control-tube and plating-vs-electronic-counting answers each require assembling sentences from two different paragraphs, the biofilm-stage-ordering question’s five lettered items do not map one-to-one onto the figure’s five numbered stages (stage 4 bundles two of the lettered items, “secretion of EPS” and “formation of water channels,” with no fixed relative order between them), and the in-dwelling-catheter question needs a general and a device-specific sentence combined — each ledger note names the passage; of the four unkeyed Critical Thinking questions, the autoinducer-size question is graded as a multiplechoice from the module’s own “small, diffusible molecules” phrase, with one distractor drawn from a source Multiple Choice item’s own named-incorrect statement about autoinducers, while the S. epidermidis catheter case, the Appendix B MPN calculation (Appendix B, m58947, is not authored in this run — its lookup table is not reproduced, so no numeric key can be fixed, and the self-check’s model answer says only what this section itself gives), and the high-density turbidity-reliability question stay self-checks. Three filler items (one multiplechoice, two textin) are added under “Describe examples of cell division not involving binary fission” and two textin fillers under “Describe the formation and characteristics of biofilms,” each built from a single body sentence of this module, to bring both objective groups to the book’s three-item floor with at least one auto-graded item apiece. Same-module figure, equation, and section cross-references are rendered as describing prose (“shown below,” “shown in the second figure below”); the two cross-references to Appendix B, Mathematical Basics (m58947, not authored in this run), are left as plain text. Key terms are compiled from the module’s 33 defined terms and the book’s Glossary appendix; “logarithmic (log) growth phase,” “Petroff-Hausser chamber,” and “most probable number (MPN) method” are each defined from the Glossary’s own entry (under the headwords “log phase,” “Petroff-Hausser counting chamber,” and “most probable number (MPN)”), correcting this page’s earlier, mistaken sentence-derived definitions for all three; one term, “viable,” has no glossary entry and is written from this module’s own sentence contrasting live and dead cells rather than the glossary’s “viable cell”/“viable plate count” entries, whose sense differs slightly. One claim is corrected against the book itself: the source calls the Actinomycetes anaerobic, which contradicts the book’s own Actinobacteria table (facultative anaerobes), so the sentence omits “anaerobic” with a visible Source note (erratum 533). No source exercise item is omitted.