Visualizing and Characterizing DNA, RNA, and Protein
By the end of this section, you will be able to:
- Explain the use of nucleic acid probes to visualize specific DNA sequences
- Explain the use of gel electrophoresis to separate DNA fragments
- Explain the principle of restriction fragment length polymorphism analysis and its uses
- Compare and contrast Southern and northern blots
- Explain the principles and uses of microarray analysis
- Describe the methods used to separate and visualize protein variants
- Explain the method and uses of polymerase chain reaction and DNA sequencing
The sequence of a DNA molecule can help us identify an organism when compared to known sequences housed in a database. The sequence can also tell us something about the function of a particular part of the DNA, such as whether it encodes a particular protein. Comparing protein signatures—the expression levels of specific arrays of proteins—between samples is an important method for evaluating cellular responses to a multitude of environmental factors and stresses. Analysis of protein signatures can reveal the identity of an organism or how a cell is responding during disease.
The DNA and proteins of interest are microscopic and typically mixed in with many other molecules including DNA or proteins irrelevant to our interests. Many techniques have been developed to isolate and characterize molecules of interest. These methods were originally developed for research purposes, but in many cases they have been simplified to the point that routine clinical use is possible. For example, many pathogens, such as the bacterium Helicobacter pylori, which causes stomach ulcers, can be detected using protein-based tests. In addition, an increasing number of highly specific and accurate DNA amplification-based identification assays can now detect pathogens such as antibiotic-resistant enteric bacteria, herpes simplex virus, varicella-zoster virus, and many others.
Molecular Analysis of DNA
In this subsection, we will outline some of the basic methods used for separating and visualizing specific fragments of DNA that are of interest to a scientist. Some of these methods do not require knowledge of the complete sequence of the DNA molecule. Before the advent of rapid DNA sequencing, these methods were the only ones available to work with DNA, but they still form the basic arsenal of tools used by molecular geneticists to study the body’s responses to microbial and other diseases.
Nucleic Acid Probing
DNA molecules are small, and the information contained in their sequence is invisible. How does a researcher isolate a particular stretch of DNA, or having isolated it, determine what organism it is from, what its sequence is, or what its function is? One method to identify the presence of a certain DNA sequence uses artificially constructed pieces of DNA called probes. Probes can be used to identify different bacterial species in the environment and many DNA probes are now available to detect pathogens clinically. For example, DNA probes are used to detect the vaginal pathogens Candida albicans, Gardnerella vaginalis, and Trichomonas vaginalis.
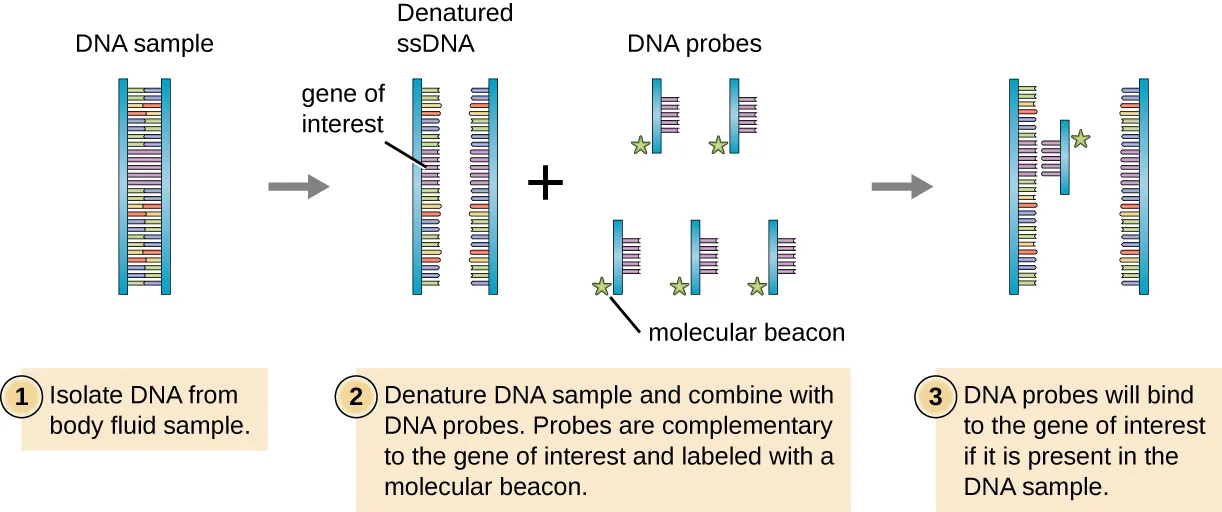
To screen a genomic library for a particular gene or sequence of interest, researchers must know something about that gene. If researchers have a portion of the sequence of DNA for the gene of interest, they can design a DNA probe, a single-stranded DNA fragment that is complementary to part of the gene of interest and different from other DNA sequences in the sample. The DNA probe may be synthesized chemically by commercial laboratories, or it may be created by cloning, isolating, and denaturing a DNA fragment from a living organism. In either case, the DNA probe must be labeled with a molecular tag or beacon, such as a radioactive phosphorus atom (as is used for autoradiography) or a fluorescent dye (as is used in fluorescent in situ hybridization, or FISH), so that the probe and the DNA it binds to can be seen (see the figure below). The DNA sample being probed must also be denatured to make it single-stranded so that the single-stranded DNA probe can anneal to the single-stranded DNA sample at locations where their sequences are complementary. While these techniques are valuable for diagnosis, their direct use on sputum and other bodily samples may be problematic due to the complex nature of these samples. DNA often must first be isolated from bodily samples through chemical extraction methods before a DNA probe can be used to identify pathogens.
Clinical Focus. Part 2
The mild, flu-like symptoms that Kayla is experiencing could be caused by any number of infectious agents. In addition, several non-infectious autoimmune conditions, such as multiple sclerosis, systemic lupus erythematosus (SLE), and amyotrophic lateral sclerosis (ALS), also have symptoms that are consistent with Kayla’s early symptoms. However, over the course of several weeks, Kayla’s symptoms worsened. She began to experience joint pain in her knees, heart palpitations, and a strange limpness in her facial muscles. In addition, she suffered from a stiff neck and painful headaches. Reluctantly, she decided it was time to seek medical attention.
- Do Kayla’s new symptoms provide any clues as to what type of infection or other medical condition she may have?
- What tests or tools might a health-care provider use to pinpoint the pathogen causing Kayla’s symptoms?
Part 3 of this case continues later on this page. The case began in Microbes and the Tools of Genetic Engineering.
Agarose Gel Electrophoresis
There are a number of situations in which a researcher might want to physically separate a collection of DNA fragments of different sizes. A researcher may also digest a DNA sample with a restriction enzyme to form fragments. The resulting size and fragment distribution pattern can often yield useful information about the sequence of DNA bases that can be used, much like a bar-code scan, to identify the individual or species to which the DNA belongs.
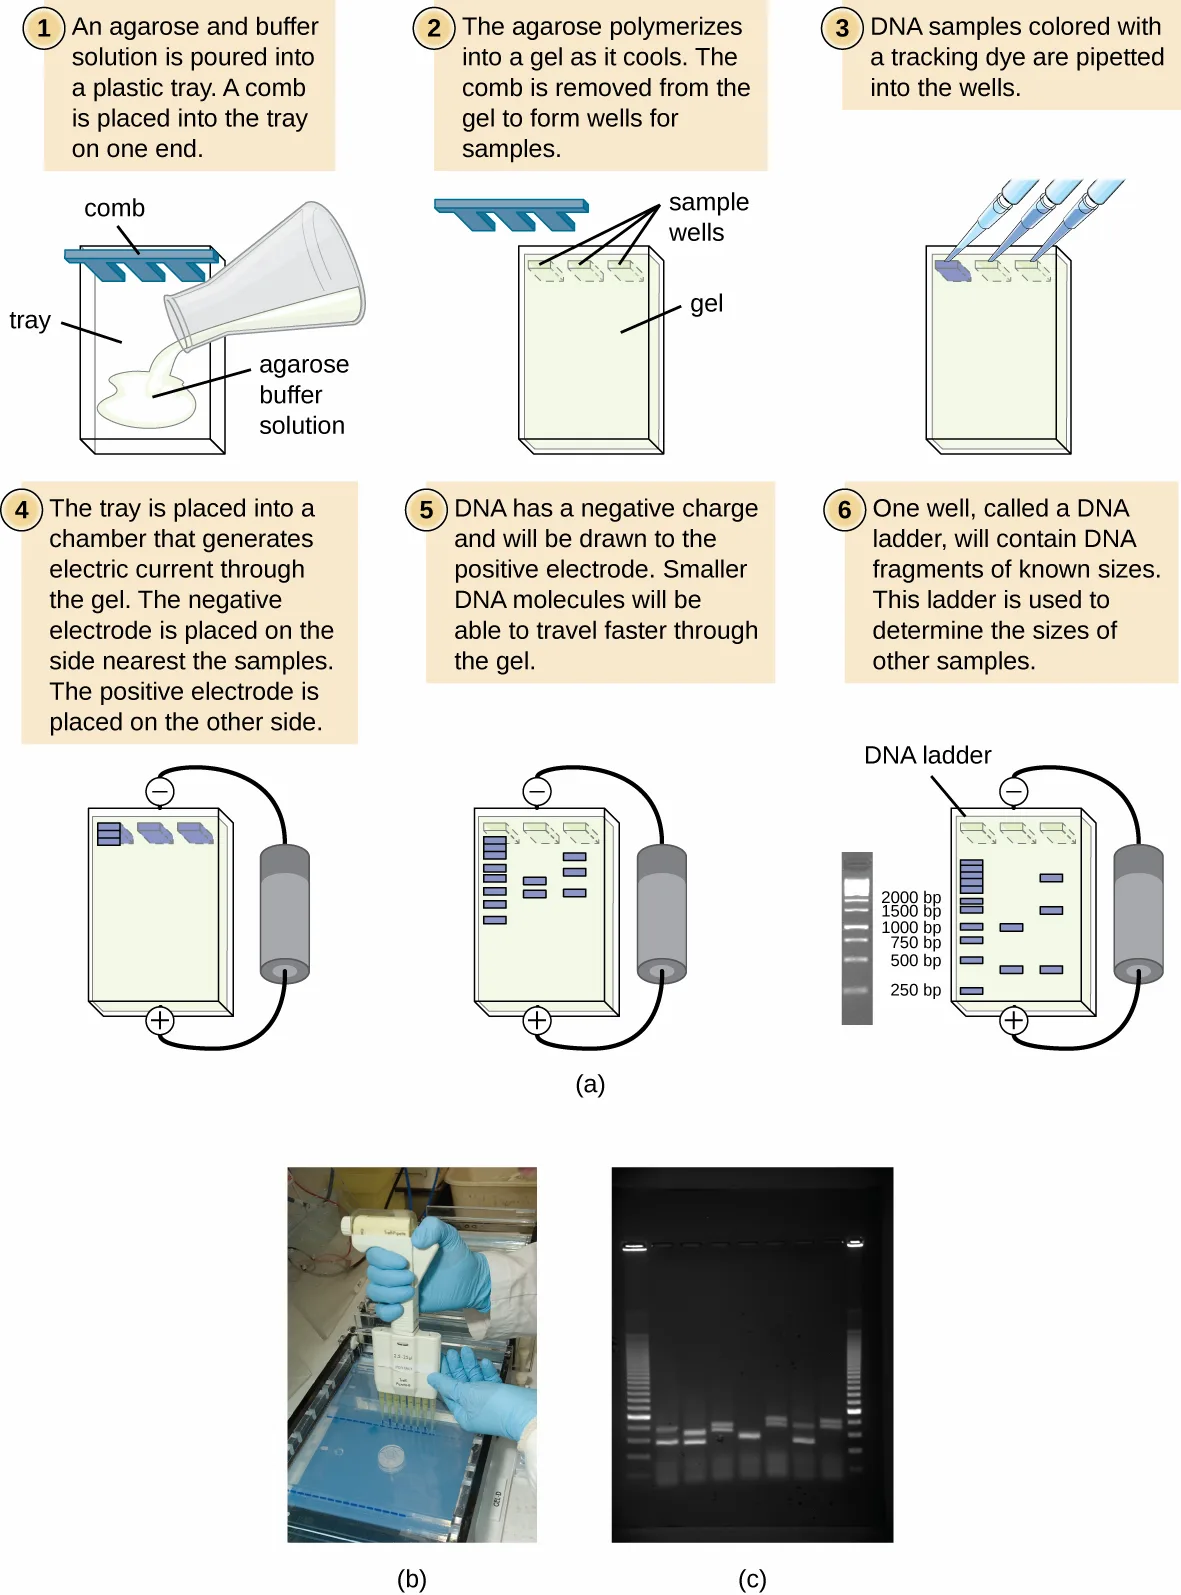
Gel electrophoresis is a technique commonly used to separate biological molecules based on size and biochemical characteristics, such as charge and polarity. Agarose gel electrophoresis is widely used to separate DNA (or RNA) of varying sizes that may be generated by restriction enzyme digestion or by other means, such as the PCR (see the figure below).
Due to its negatively charged backbone, DNA is strongly attracted to a positive electrode. In agarose gel electrophoresis, the gel is oriented horizontally in a buffer solution. Samples are loaded into sample wells on the side of the gel closest to the negative electrode, then drawn through the molecular sieve of the agarose matrix toward the positive electrode. The agarose matrix impedes the movement of larger molecules through the gel, whereas smaller molecules pass through more readily. Thus, the distance of migration is inversely correlated to the size of the DNA fragment, with smaller fragments traveling a longer distance through the gel. Sizes of DNA fragments within a sample can be estimated by comparison to fragments of known size in a DNA ladder also run on the same gel. To separate very large DNA fragments, such as chromosomes or viral genomes, agarose gel electrophoresis can be modified by periodically alternating the orientation of the electric field during pulsed-field gel electrophoresis (PFGE). In PFGE, smaller fragments can reorient themselves and migrate slightly faster than larger fragments and this technique can thus serve to separate very large fragments that would otherwise travel together during standard agarose gel electrophoresis. In any of these electrophoresis techniques, the locations of the DNA or RNA fragments in the gel can be detected by various methods. One common method is adding ethidium bromide, a stain that inserts into the nucleic acids at non-specific locations and can be visualized when exposed to ultraviolet light. Other stains that are safer than ethidium bromide, a potential carcinogen, are now available.
Extended description
Panel (a), six numbered steps: 1) an agarose-and-buffer solution is poured from a beaker into a plastic tray fitted with a comb at one end; 2) once cooled, the comb is removed, leaving a row of sample wells in the set gel; 3) micropipette tips add dye-colored DNA samples into the wells; 4) the loaded tray sits in a chamber wired to a power source, with the negative electrode on the side nearest the wells and the positive electrode on the far side; 5) DNA, being negatively charged, migrates toward the positive electrode, with smaller fragments (shown as bands lower in the gel) traveling faster and farther than larger fragments (bands higher up, closer to the wells); 6) one lane holds a DNA ladder of fragments with known sizes, labeled top to bottom 2000 bp, 1500 bp, 1000 bp, 750 bp, 500 bp, and 250 bp, used to estimate the sizes of the sample bands in the neighboring lanes. Panel (b): a photograph of a gloved researcher using a multichannel pipette to load samples into a gel tray. Panel (c): a photograph of a completed gel photographed under ultraviolet light, with a DNA ladder’s evenly spaced glowing bands in the outer lanes and seven sample lanes of unevenly spaced glowing bands in between.
Restriction Fragment Length Polymorphism (RFLP) Analysis
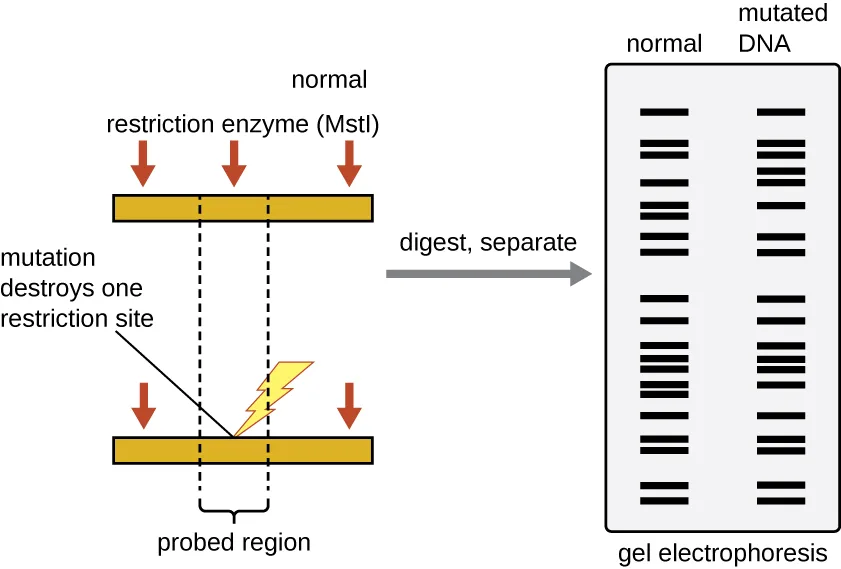
Restriction enzyme recognition sites are short (only a few nucleotides long), sequence-specific palindromes, and may be found throughout the genome. Thus, differences in DNA sequences in the genomes of individuals will lead to differences in distribution of restriction-enzyme recognition sites that can be visualized as distinct banding patterns on a gel after agarose gel electrophoresis. Restriction fragment length polymorphism (RFLP) analysis compares DNA banding patterns of different DNA samples after restriction digestion (see the figure below).
RFLP analysis has many practical applications in both medicine and forensic science. For example, epidemiologists use RFLP analysis to track and identify the source of specific microorganisms implicated in outbreaks of food poisoning or certain infectious diseases. RFLP analysis can also be used on human DNA to determine inheritance patterns of chromosomes with variant genes, including those associated with heritable diseases or to establish paternity.
Forensic scientists use RFLP analysis as a form of DNA fingerprinting, which is useful for analyzing DNA obtained from crime scenes, suspects, and victims. DNA samples are collected, the numbers of copies of the sample DNA molecules are increased using PCR, and then subjected to restriction enzyme digestion and agarose gel electrophoresis to generate specific banding patterns. By comparing the banding patterns of samples collected from the crime scene against those collected from suspects or victims, investigators can definitively determine whether DNA evidence collected at the scene was left behind by suspects or victims.
Southern Blots and Modifications
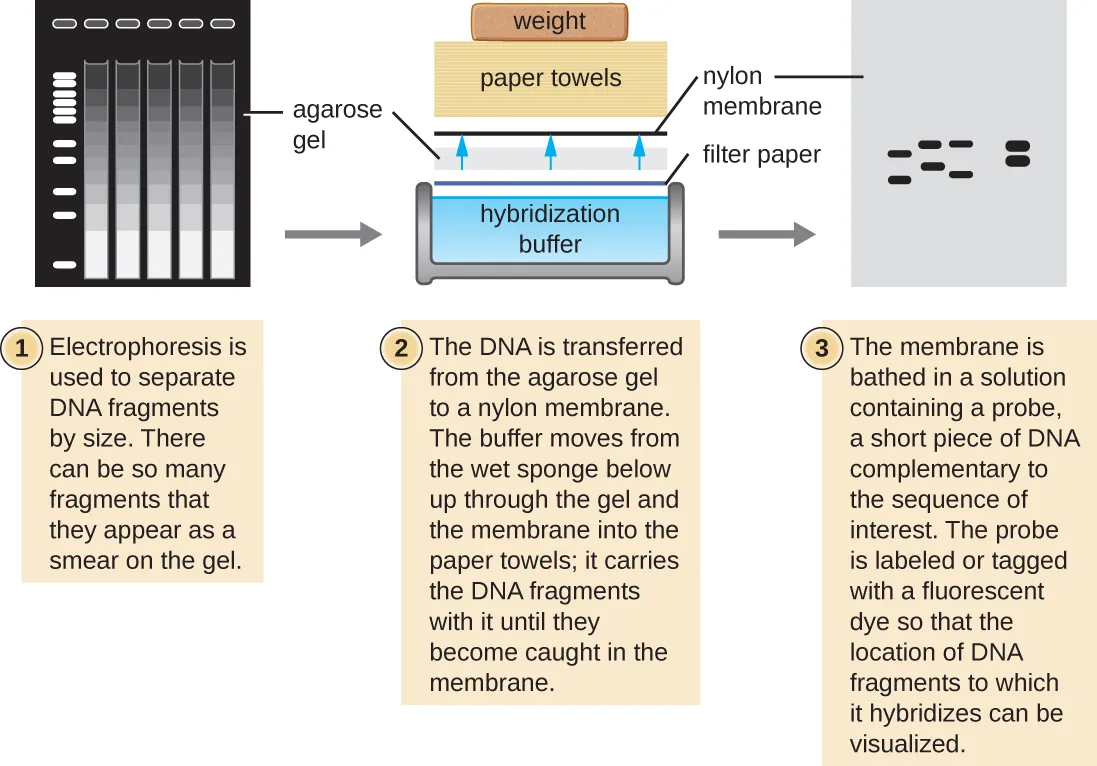
Several molecular techniques capitalize on sequence complementarity and hybridization between nucleic acids of a sample and DNA probes. Typically, probing nucleic-acid samples within a gel is unsuccessful because as the DNA probe soaks into a gel, the sample nucleic acids within the gel diffuse out. Thus, blotting techniques are commonly used to transfer nucleic acids to a thin, positively charged membrane made of nitrocellulose or nylon. In the Southern blot technique, developed by Sir Edwin Southern in 1975, DNA fragments within a sample are first separated by agarose gel electrophoresis and then transferred to a membrane through capillary action (see the figure below). The DNA fragments that bind to the surface of the membrane are then exposed to a specific single-stranded DNA probe labeled with a radioactive or fluorescent molecular beacon to aid in detection. Southern blots may be used to detect the presence of certain DNA sequences in a given DNA sample. Once the target DNA within the membrane is visualized, researchers can cut out the portion of the membrane containing the fragment to recover the DNA fragment of interest.
Variations of the Southern blot—the dot blot, slot blot, and the spot blot—do not involve electrophoresis, but instead concentrate DNA from a sample into a small location on a membrane. After hybridization with a DNA probe, the signal intensity detected is measured, allowing the researcher to estimate the amount of target DNA present within the sample.
A colony blot is another variation of the Southern blot in which colonies representing different clones in a genomic library are transferred to a membrane by pressing the membrane onto the culture plate. The cells on the membrane are lysed and the membrane can then be probed to determine which colonies within a genomic library harbor the target gene. Because the colonies on the plate are still growing, the cells of interest can be isolated from the plate.
In the northern blot, another variation of the Southern blot, RNA (not DNA) is immobilized on the membrane and probed. Northern blots are typically used to detect the amount of mRNA made through gene expression within a tissue or organism sample.
Microarray Analysis
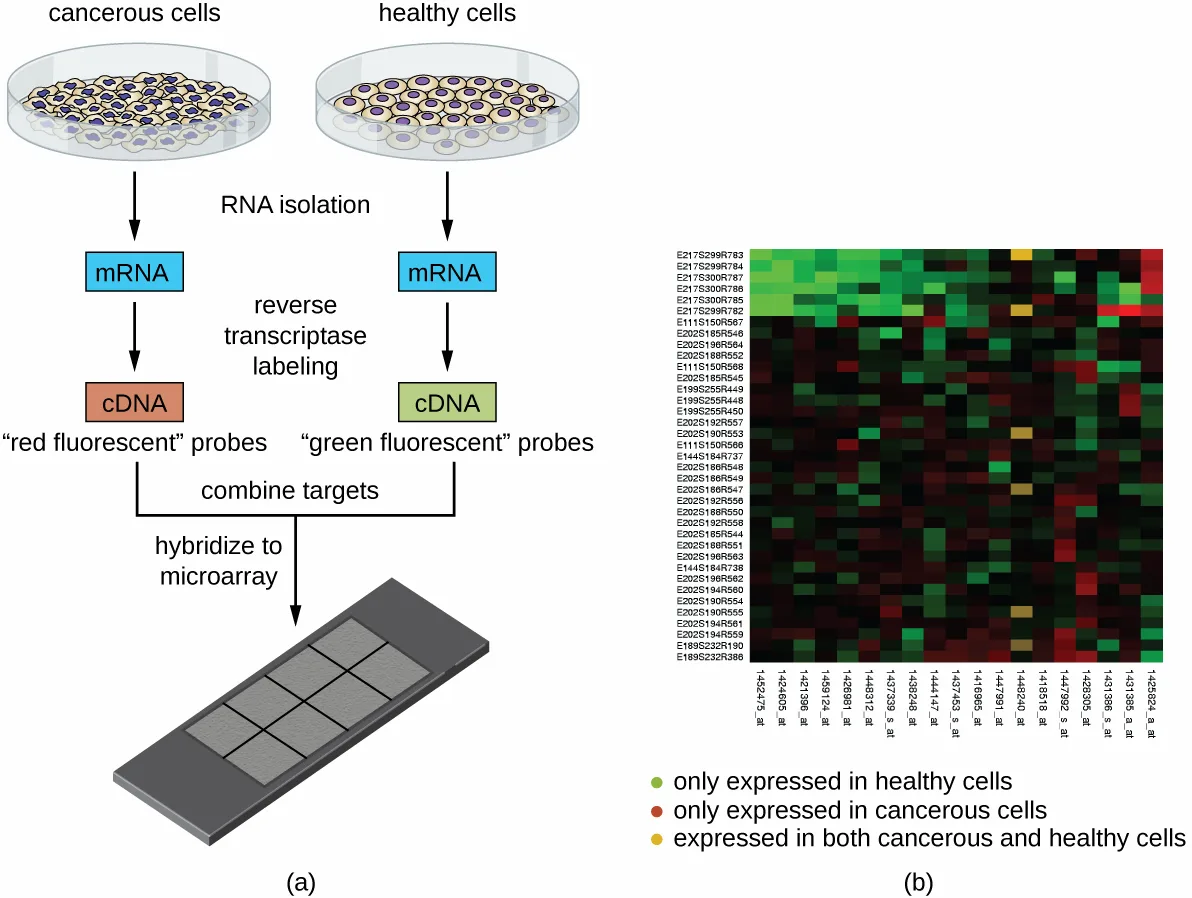
Another technique that capitalizes on the hybridization between complementary nucleic acid sequences is called microarray analysis. Microarray analysis is useful for the comparison of gene-expression patterns between different cell types—for example, cells infected with a virus versus uninfected cells, or cancerous cells versus healthy cells (see the figure below).
Typically, DNA or cDNA from an experimental sample is deposited on a glass slide alongside known DNA sequences. Each slide can hold more than 30,000 different DNA fragment types. Distinct DNA fragments (encompassing an organism’s entire genomic library) or cDNA fragments (corresponding to an organism’s full complement of expressed genes) can be individually spotted on a glass slide.
Once deposited on the slide, genomic DNA or mRNA can be isolated from the two samples for comparison. If mRNA is isolated, it is reverse-transcribed to cDNA using reverse transcriptase. Then the two samples of genomic DNA or cDNA are labeled with different fluorescent dyes (typically red and green). The labeled genomic DNA samples are then combined in equal amounts, added to the microarray chip, and allowed to hybridize to complementary spots on the microarray.
Hybridization of sample genomic DNA molecules can be monitored by measuring the intensity of fluorescence at particular spots on the microarray. Differences in the amount of hybridization between the samples can be readily observed. If only one sample’s nucleic acids hybridize to a particular spot on the microarray, then that spot will appear either green or red. However, if both samples’ nucleic acids hybridize, then the spot will appear yellow due to the combination of the red and green dyes.
Although microarray technology allows for a holistic comparison between two samples in a short time, it requires sophisticated (and expensive) detection equipment and analysis software. Because of the expense, this technology is typically limited to research settings. Researchers have used microarray analysis to study how gene expression is affected in organisms that are infected by bacteria or viruses or subjected to certain chemical treatments.
Extended description
Panel (a), top to bottom: a dish of cancerous cells and a dish of healthy cells are cultured side by side; an arrow labeled ‘RNA isolation’ leads from each dish to a box labeled mRNA; an arrow labeled ‘reverse transcriptase labeling’ leads from the cancerous-cell mRNA to a box labeled cDNA under a ‘red fluorescent probes’ caption, and from the healthy-cell mRNA to a box labeled cDNA under a ‘green fluorescent probes’ caption; both cDNA boxes feed into a ‘combine targets’ step and then a ‘hybridize to microarray’ step, ending at a drawing of a gray microarray chip divided into a grid of squares. Panel (b): a heat-map grid with sample identifiers running down the left side and probe identifiers running along the bottom; most cells are colored green, red, black, or yellow, with a small legend below reading green for genes expressed only in healthy cells, red for genes expressed only in cancerous cells, and yellow for genes expressed in both.
Link to Learning
Explore microchip technology at this interactive website.
Check Your Understanding
What does a DNA probe consist of?
Recall what kind of molecule the section says a researcher designs to find a gene of interest, and how many strands it has.Why is a Southern blot used after gel electrophoresis of a DNA digest?
Show model answer
Did your answer mention:
Molecular Analysis of Proteins
In many cases it may not be desirable or possible to study DNA or RNA directly. Proteins can provide species-specific information for identification as well as important information about how and whether a cell or tissue is responding to the presence of a pathogenic microorganism. Various proteins require different methods for isolation and characterization.
Polyacrylamide Gel Electrophoresis
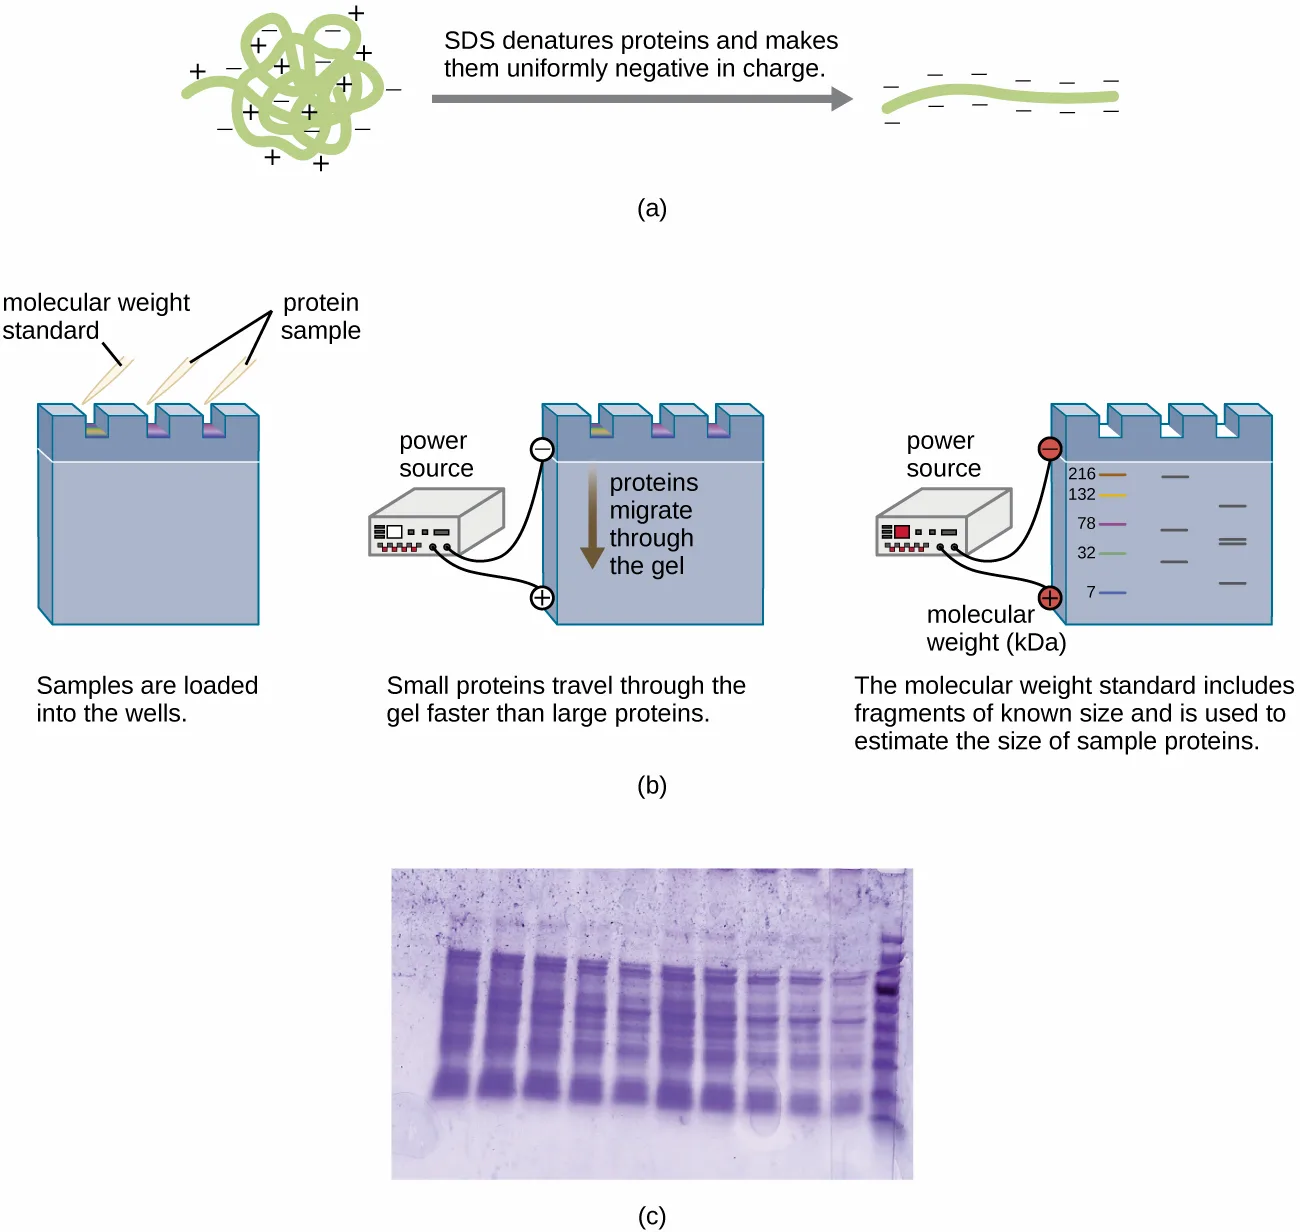
A variation of gel electrophoresis, called polyacrylamide gel electrophoresis (PAGE), is commonly used for separating proteins. In PAGE, the gel matrix is finer and composed of polyacrylamide instead of agarose. Additionally, PAGE is typically performed using a vertical gel apparatus (see the figure below). Because of the varying charges associated with amino acid side chains, PAGE can be used to separate intact proteins based on their net charges. Alternatively, proteins can be denatured and coated with a negatively charged detergent called sodium dodecyl sulfate (SDS), masking the native charges and allowing separation based on size only. PAGE can be further modified to separate proteins based on two characteristics, such as their charges at various pHs as well as their size, through the use of two-dimensional PAGE. In any of these cases, following electrophoresis, proteins are visualized through staining, commonly with either Coomassie blue or a silver stain.
Extended description
Panel (a): a tangled, coiled protein strand marked with scattered plus and minus charges is redrawn, after an arrow labeled ‘SDS denatures proteins and makes them uniformly negative in charge,’ as a straight, unfolded strand carrying only minus signs along its length. Panel (b), three steps: first, protein samples and a molecular-weight standard are pipetted into wells at the top of a vertical gel, with the standard’s lane and the protein-sample lanes labeled; second, the gel sits between a power source’s negative terminal at the top and positive terminal at the bottom, with an arrow showing proteins migrating downward, small proteins moving faster than large ones; third, the finished gel shows the molecular-weight standard lane with bands labeled 216, 132, 78, 32, and 7 (kDa) beside sample lanes whose band positions can be compared against it. Panel (c): a photograph of a Coomassie-blue-stained polyacrylamide gel with ten lanes of purple protein bands of varying intensity and spacing, and a ladder of evenly spaced bands in the rightmost lane.
Check Your Understanding
On what basis are proteins separated in SDS-PAGE?
Recall what SDS does to a protein’s native charge before the sample is loaded onto the gel.Clinical Focus. Part 3
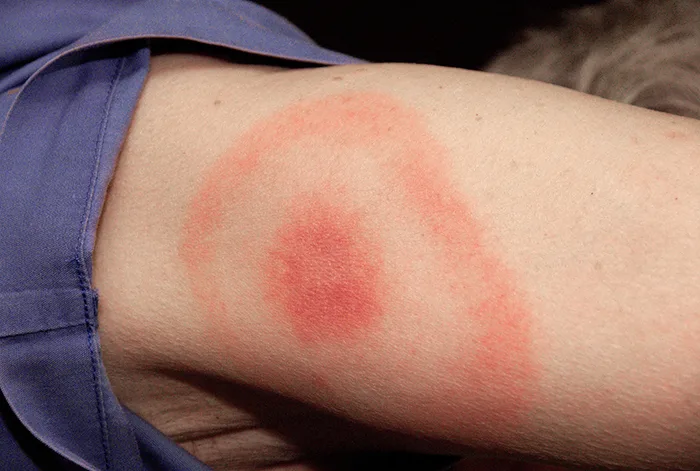
When Kayla described her symptoms, her physician at first suspected bacterial meningitis, which is consistent with her headaches and stiff neck. However, she soon ruled this out as a possibility because meningitis typically progresses more quickly than what Kayla was experiencing. Many of her symptoms still paralleled those of amyotrophic lateral sclerosis (ALS) and systemic lupus erythematosus (SLE), and the physician also considered Lyme disease a possibility given how much time Kayla spends in the woods. Kayla did not recall any recent tick bites (the typical means by which Lyme disease is transmitted) and she did not have the typical bull’s-eye rash associated with Lyme disease (see the figure below). However, 20–30% of patients with Lyme disease never develop this rash, so the physician did not want to rule it out.
Kayla’s doctor ordered an MRI of her brain, a complete blood count to test for anemia, blood tests assessing liver and kidney function, and additional tests to confirm or rule out SLE or Lyme disease. Her test results were inconsistent with both SLE and ALS, and the result of the test looking for Lyme disease antibodies was “equivocal,” meaning inconclusive. Having ruled out ALS and SLE, Kayla’s doctor decided to run additional tests for Lyme disease.
- Why would Kayla’s doctor still suspect Lyme disease even if the test results did not detect Lyme antibodies in the blood?
- What type of molecular test might be used for the detection of blood antibodies to Lyme disease?
The case continues in Whole Genome Methods and Pharmaceutical Applications of Genetic Engineering. Part 2 of this case appears earlier on this page. The case began in Microbes and the Tools of Genetic Engineering.
Amplification-Based DNA Analysis Methods
Various methods can be used for obtaining sequences of DNA, which are useful for studying disease-causing organisms. With the advent of rapid sequencing technology, our knowledge base of the entire genomes of pathogenic organisms has grown phenomenally. We start with a description of the polymerase chain reaction, which is not a sequencing method but has allowed researchers and clinicians to obtain the large quantities of DNA needed for sequencing and other studies. The polymerase chain reaction eliminates the dependence we once had on cells to make multiple copies of DNA, achieving the same result through relatively simple reactions outside the cell.
Polymerase Chain Reaction (PCR)
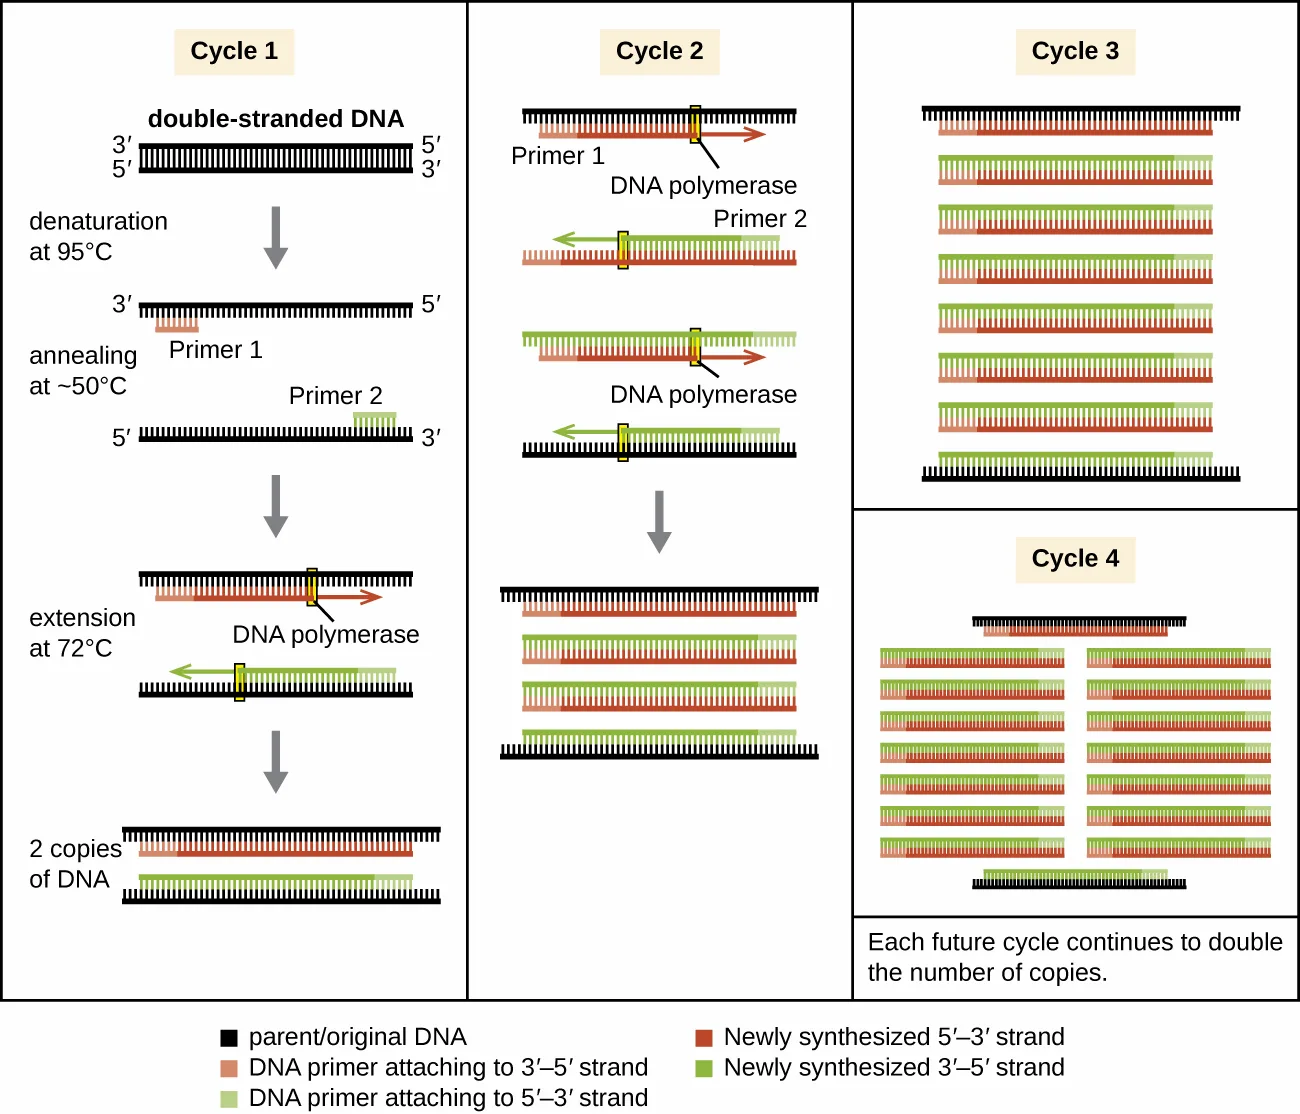
Most methods of DNA analysis, such as restriction enzyme digestion and agarose gel electrophoresis, or DNA sequencing require large amounts of a specific DNA fragment. In the past, large amounts of DNA were produced by growing the host cells of a genomic library. However, libraries take time and effort to prepare and DNA samples of interest often come in minute quantities. The polymerase chain reaction (PCR) permits rapid amplification in the number of copies of specific DNA sequences for further analysis (see the figure below). One of the most powerful techniques in molecular biology, PCR was developed in 1983 by Kary Mullis while at Cetus Corporation. PCR has specific applications in research, forensic, and clinical laboratories, including:
- determining the sequence of nucleotides in a specific region of DNA
- amplifying a target region of DNA for cloning into a plasmid vector
- identifying the source of a DNA sample left at a crime scene
- analyzing samples to determine paternity
- comparing samples of ancient DNA with modern organisms
- determining the presence of difficult to culture, or unculturable, microorganisms in humans or environmental samples
PCR is an in vitro laboratory technique that takes advantage of the natural process of DNA replication. The heat-stable DNA polymerase enzymes used in PCR are derived from hyperthermophilic prokaryotes. Taq DNA polymerase, commonly used in PCR, is derived from the Thermus aquaticus bacterium isolated from a hot spring in Yellowstone National Park. DNA replication requires the use of primers for the initiation of replication to have free 3′-hydroxyl groups available for the addition of nucleotides by DNA polymerase. However, while primers composed of RNA are normally used in cells, DNA primers are used for PCR. DNA primers are preferable due to their stability, and DNA primers with known sequences targeting a specific DNA region can be chemically synthesized commercially. These DNA primers are functionally similar to the DNA probes used for the various hybridization techniques described earlier, binding to specific targets due to complementarity between the target DNA sequence and the primer.
PCR occurs over multiple cycles, each containing three steps: denaturation, annealing, and extension. Machines called thermal cyclers are used for PCR; these machines can be programmed to automatically cycle through the temperatures required at each step (see the thermal cycler photo in this chapter’s introduction). First, double-stranded template DNA containing the target sequence is denatured at approximately 95 °C. The high temperature required to physically (rather than enzymatically) separate the DNA strands is the reason the heat-stable DNA polymerase is required. Next, the temperature is lowered to approximately 50 °C. This allows the DNA primers complementary to the ends of the target sequence to anneal (stick) to the template strands, with one primer annealing to each strand. Finally, the temperature is raised to 72 °C, the optimal temperature for the activity of the heat-stable DNA polymerase, allowing for the addition of nucleotides to the primer using the single-stranded target as a template. Each cycle doubles the number of double-stranded target DNA copies. Typically, PCR protocols include 25–40 cycles, allowing for the amplification of a single target sequence by tens of millions to over a trillion.
Natural DNA replication is designed to copy the entire genome, and initiates at one or more origin sites. Primers are constructed during replication, not before, and do not consist of a few specific sequences. PCR targets specific regions of a DNA sample using sequence-specific primers. In recent years, a variety of isothermal PCR amplification methods that circumvent the need for thermal cycling have been developed, taking advantage of accessory proteins that aid in the DNA replication process. As the development of these methods continues and their use becomes more widespread in research, forensic, and clinical labs, thermal cyclers may become obsolete.
Link to Learning
Deepen your understanding of the polymerase chain reaction by viewing this animation and working through an interactive exercise.
PCR Variations
Several later modifications to PCR further increase the utility of this technique. Reverse transcriptase PCR (RT-PCR) is used for obtaining DNA copies of a specific mRNA molecule. RT-PCR begins with the use of the reverse transcriptase enzyme to convert mRNA molecules into cDNA. That cDNA is then used as a template for traditional PCR amplification. RT-PCR can detect whether a specific gene has been expressed in a sample. Another recent application of PCR is real-time PCR, also known as quantitative PCR (qPCR). Standard PCR and RT-PCR protocols are not quantitative because any one of the reagents may become limiting before all of the cycles within the protocol are complete, and samples are only analyzed at the end. Because it is not possible to determine when in the PCR or RT-PCR protocol a given reagent has become limiting, it is not possible to know how many cycles were completed prior to this point, and thus it is not possible to determine how many original template molecules were present in the sample at the start of PCR. In qPCR, however, the use of fluorescence allows one to monitor the increase in a double-stranded template during a PCR reaction as it occurs. These kinetics data can then be used to quantify the amount of the original target sequence. The use of qPCR in recent years has further expanded the capabilities of PCR, allowing researchers to determine the number of DNA copies, and sometimes organisms, present in a sample. In clinical settings, qRT-PCR is used to determine viral load in HIV-positive patients to evaluate the effectiveness of their therapy.
DNA Sequencing
A basic sequencing technique is the chain termination method, also known as the dideoxy method or the Sanger DNA sequencing method, developed by Frederick Sanger in 1977.
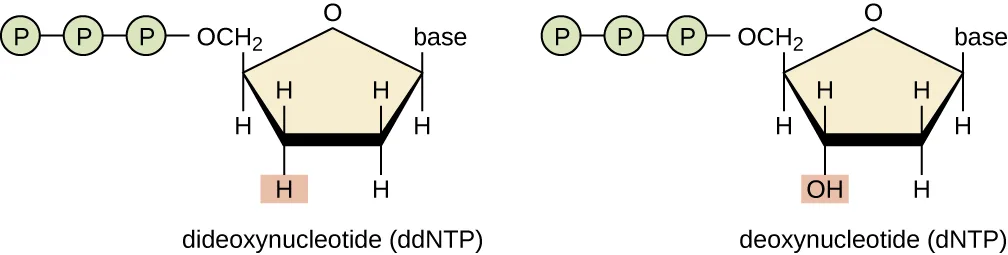
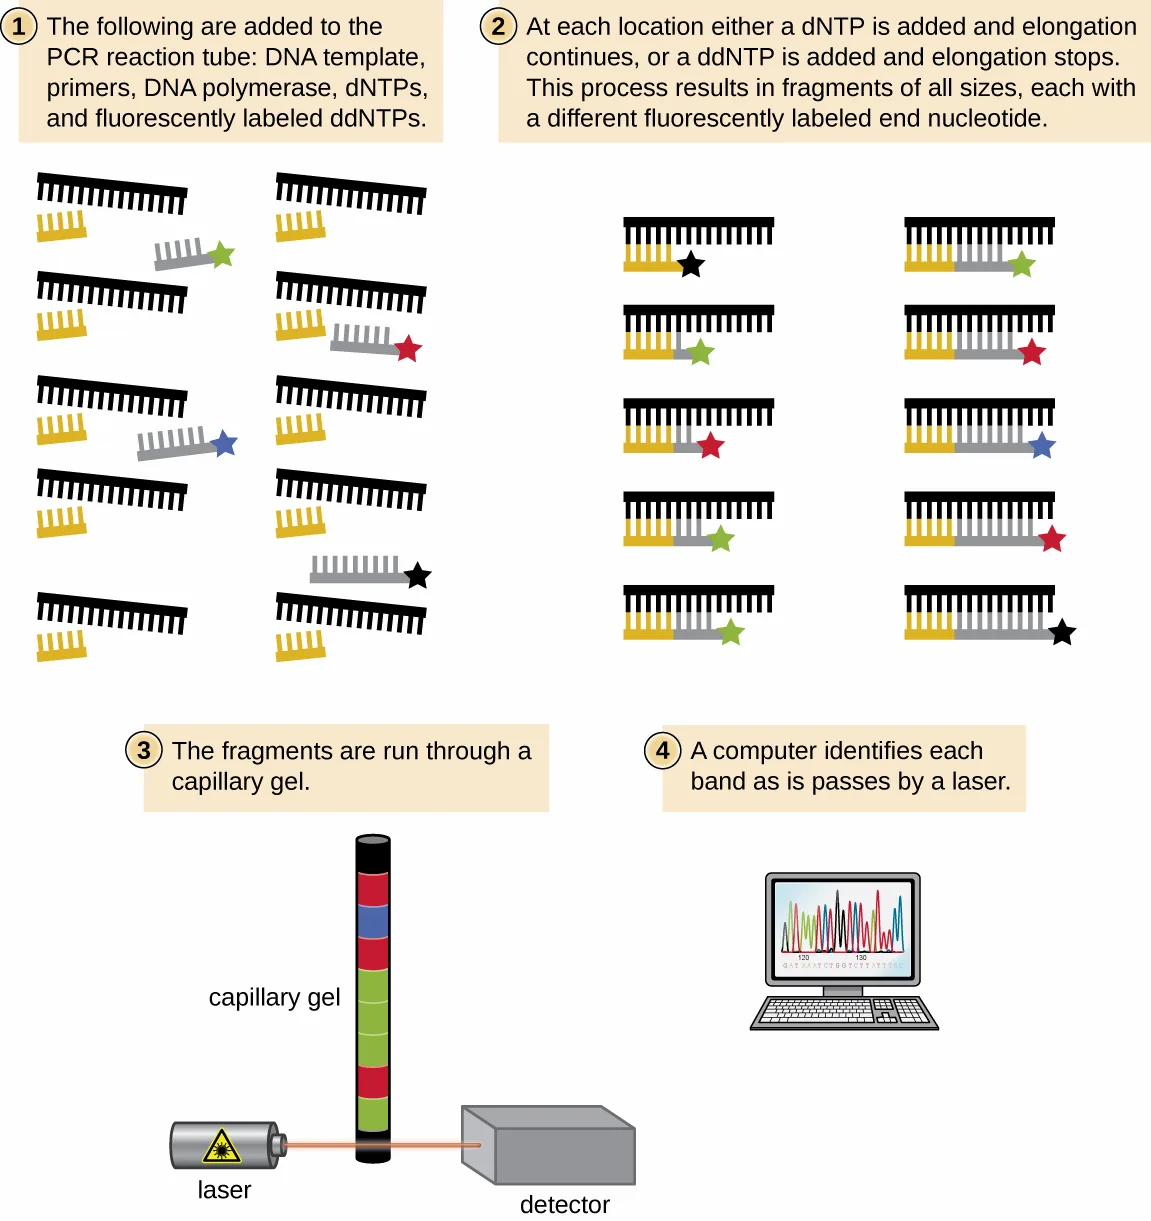
(Source note: the source says 1972. The dideoxy chain-termination method was published in 1977 (Sanger, Nicklen, and Coulson, PNAS 74 (1977): 5463–5467); Sanger had no published DNA sequencing method in 1972, so the page prints 1977.) The chain termination method involves DNA replication of a single-stranded template with the use of a DNA primer to initiate synthesis of a complementary strand, DNA polymerase, a mix of the four regular deoxynucleotide (dNTP) monomers, and a small proportion of dideoxynucleotides (ddNTPs), each labeled with a molecular beacon. The ddNTPs are monomers missing a hydroxyl group (–OH) at the site at which another nucleotide usually attaches to form a chain (see the figure below). Every time a ddNTP is randomly incorporated into the growing complementary strand, it terminates the process of DNA replication for that particular strand. This results in multiple short strands of replicated DNA that are each terminated at a different point during replication. When the reaction mixture is subjected to gel electrophoresis, the multiple newly replicated DNA strands form a ladder of differing sizes. Because the ddNTPs are labeled, each band on the gel reflects the size of the DNA strand when the ddNTP terminated the reaction.
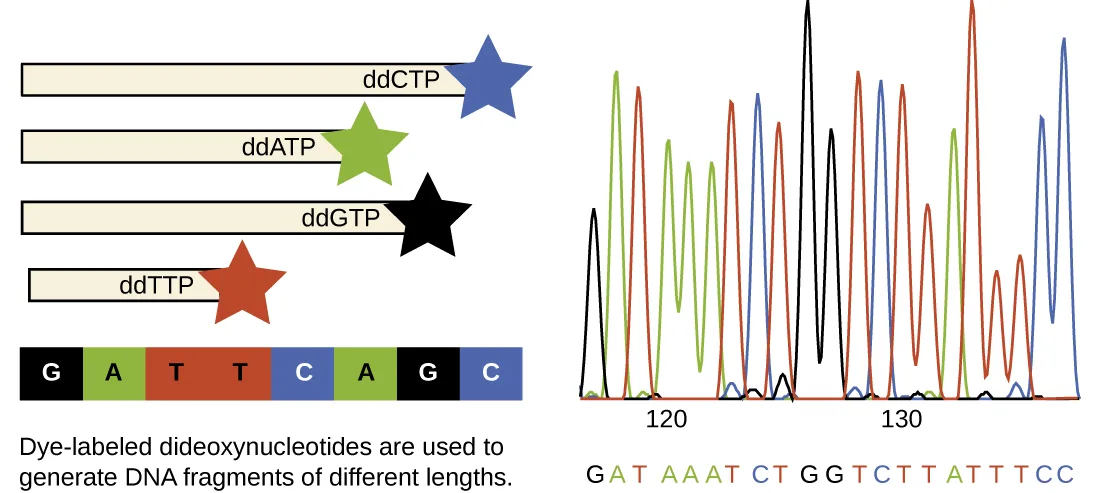
In Sanger’s day, four reactions were set up for each DNA molecule being sequenced, each reaction containing only one of the four possible ddNTPs. Each ddNTP was labeled with a radioactive phosphorus molecule. The products of the four reactions were then run in separate lanes side by side on long, narrow PAGE gels, and the bands of varying lengths were detected by autoradiography. Today, this process has been simplified with the use of ddNTPs, each labeled with a different colored fluorescent dye or fluorochrome (see the figure below), in one sequencing reaction containing all four possible ddNTPs for each DNA molecule being sequenced (see the figure below). These fluorochromes are detected by fluorescence spectroscopy. Determining the fluorescence color of each band as it passes by the detector produces the nucleotide sequence of the template strand.
Since 2005, automated sequencing techniques used by laboratories fall under the umbrella of next generation sequencing, which is a group of automated techniques used for rapid DNA sequencing. These methods have revolutionized the field of molecular genetics because the low-cost sequencers can generate sequences of hundreds of thousands or millions of short fragments (25 to 600 base pairs) just in one day. Although several variants of next generation sequencing technologies are made by different companies (for example, 454 Life Sciences’ pyrosequencing and Illumina’s Solexa technology), they all allow millions of bases to be sequenced quickly, making the sequencing of entire genomes relatively easy, inexpensive, and commonplace. In 454 sequencing (pyrosequencing), for example, a DNA sample is fragmented into 400–600-bp single-strand fragments, modified with the addition of DNA adapters to both ends of each fragment. Each DNA fragment is then immobilized on a bead and amplified by PCR, using primers designed to anneal to the adapters, creating a bead containing many copies of that DNA fragment. Each bead is then put into a separate well containing sequencing enzymes. To the well, each of the four nucleotides is added one after the other; when each one is incorporated, pyrophosphate is released as a byproduct of polymerization, emitting a small flash of light that is recorded by a detector. This provides the order of nucleotides incorporated as a new strand of DNA is made and is an example of synthesis sequencing. Next generation sequencers use sophisticated software to get through the cumbersome process of putting all the fragments in order. Overall, these technologies continue to advance rapidly, decreasing the cost of sequencing and increasing the availability of sequence data from a wide variety of organisms quickly.
The National Center for Biotechnology Information houses a widely used genetic sequence database called GenBank where researchers deposit genetic information for public use. Upon publication of sequence data, researchers upload it to GenBank, giving other researchers access to the information. The collaboration allows researchers to compare newly discovered or unknown sample sequence information with the vast array of sequence data that already exists.
Link to Learning
View an animation about 454 sequencing to deepen your understanding of this method.
Case in Point. Using a NAAT to Diagnose a C. difficile Infection
Javier, an 80-year-old patient with a history of heart disease, recently returned home from the hospital after undergoing an angioplasty procedure to insert a stent into a cardiac artery. To minimize the possibility of infection, Javier was administered intravenous broad-spectrum antibiotics during and shortly after his procedure. He was released four days after the procedure, but a week later, he began to experience mild abdominal cramping and watery diarrhea several times a day. He lost his appetite, became severely dehydrated, and developed a fever. He also noticed blood in his stool. Javier’s wife called the physician, who instructed her to take him to the emergency room immediately.
The hospital staff ran several tests and found that Javier’s kidney creatinine levels were elevated compared with the levels in his blood, indicating that his kidneys were not functioning well. Javier’s symptoms suggested a possible infection with Clostridioides difficile, a bacterium that is resistant to many antibiotics. The hospital collected and cultured a stool sample to look for the production of toxins A and B by C. difficile, but the results came back negative. However, the negative results were not enough to rule out a C. difficile infection because culturing of C. difficile and detection of its characteristic toxins can be difficult, particularly in some types of samples. To be safe, they proceeded with a diagnostic nucleic acid amplification test (NAAT). Currently NAATs are the clinical diagnostician’s gold standard for detecting the genetic material of a pathogen. In Javier’s case, qPCR was used to look for the gene encoding C. difficile toxin B (tcdB). When the qPCR analysis came back positive, the attending physician concluded that Javier was indeed suffering from a C. difficile infection and immediately prescribed the antibiotic vancomycin, to be administered intravenously. The antibiotic cleared the infection and Javier made a full recovery.
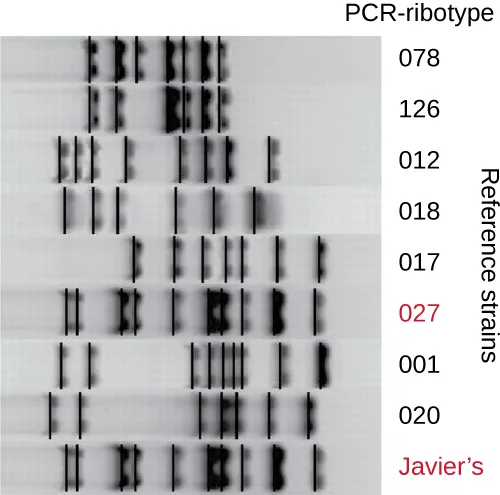
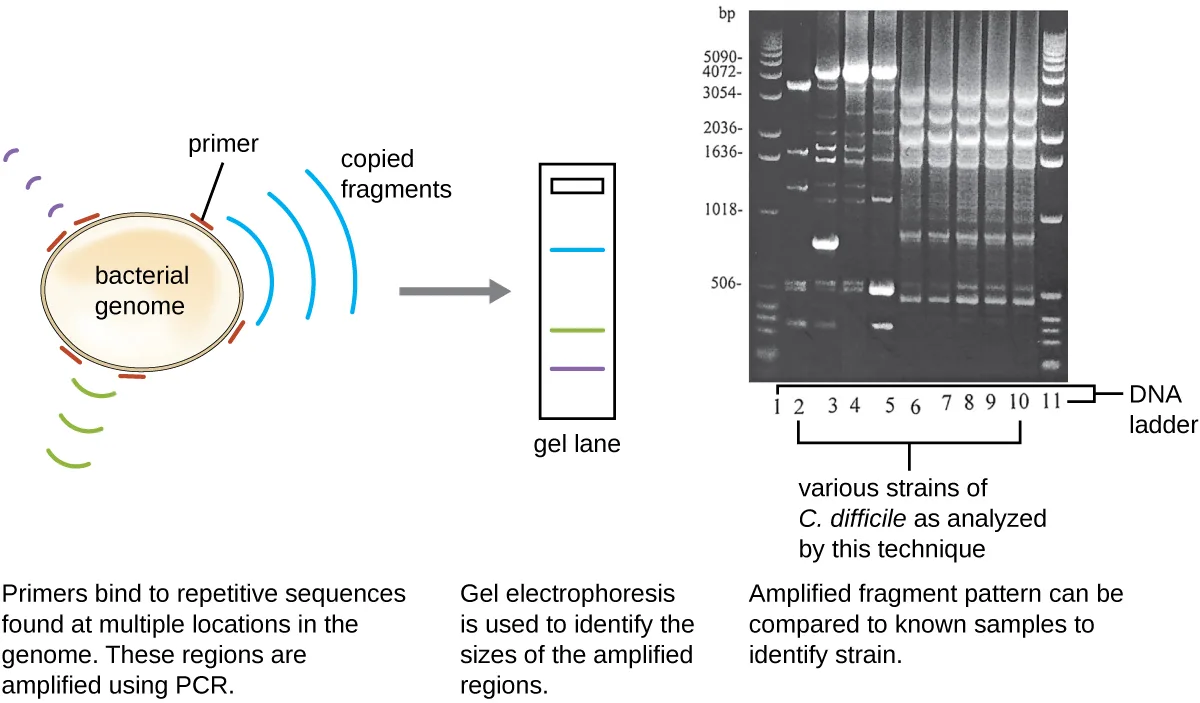
Because infections with C. difficile were becoming widespread in Javier’s community, his sample was further analyzed to see whether the specific strain of C. difficile could be identified. Javier’s stool sample was subjected to ribotyping and repetitive sequence-based PCR (rep-PCR) analysis. In ribotyping, a short sequence of DNA between the 16S rRNA and 23S rRNA genes is amplified and subjected to restriction digestion (see the figure below). This sequence varies between strains of C. difficile, so restriction enzymes will cut in different places. In rep-PCR, DNA primers designed to bind to short sequences commonly found repeated within the C. difficile genome were used for PCR. Following restriction digestion, agarose gel electrophoresis was performed in both types of analysis to examine the banding patterns that resulted from each procedure (see the figure below). Rep-PCR can be used to further subtype various ribotypes, increasing resolution for detecting differences between strains. The ribotype of the strain infecting Javier was found to be ribotype 27, a strain known for its increased virulence, resistance to antibiotics, and increased prevalence in the United States, Canada, Japan, and Europe. (Patrizia Spigaglia, Fabrizio Barbanti, Anna Maria Dionisi, and Paola Mastrantonio, “Clostridioides difficile Isolates Resistant to Fluoroquinolones in Italy: Emergence of PCR Ribotype 018,” Journal of Clinical Microbiology 48, no. 8 (2010): 2892–2896.)
- How do banding patterns differ between strains of C. difficile?
- Why do you think laboratory tests were unable to detect toxin production directly?
Check Your Understanding
How is PCR similar to the natural DNA replication process in cells? How is it different?
Show model answer
Did your answer mention:
Compare RT-PCR and qPCR in terms of their respective purposes.
Show model answer
Did your answer mention:
In chain-termination sequencing, how is the identity of each nucleotide in a sequence determined?
Show model answer
Did your answer mention:
Summary
- Finding a gene of interest within a sample requires the use of a single-stranded DNA probe labeled with a molecular beacon (typically radioactivity or fluorescence) that can hybridize with a complementary single-stranded nucleic acid in the sample.
- Agarose gel electrophoresis allows for the separation of DNA molecules based on size.
- Restriction fragment length polymorphism (RFLP) analysis allows for the visualization by agarose gel electrophoresis of distinct variants of a DNA sequence caused by differences in restriction sites.
- Southern blot analysis allows researchers to find a particular DNA sequence within a sample whereas northern blot analysis allows researchers to detect a particular mRNA sequence expressed in a sample.
- Microarray technology is a nucleic acid hybridization technique that allows for the examination of many thousands of genes at once to find differences in genes or gene expression patterns between two samples of genomic DNA or cDNA.
- Polyacrylamide gel electrophoresis (PAGE) allows for the separation of proteins by size, especially if native protein charges are masked through pretreatment with SDS.
- Polymerase chain reaction allows for the rapid amplification of a specific DNA sequence. Variations of PCR can be used to detect mRNA expression (reverse transcriptase PCR) or to quantify a particular sequence in the original sample (real-time PCR).
- Although the development of Sanger DNA sequencing was revolutionary, advances in next generation sequencing allow for the rapid and inexpensive sequencing of the genomes of many organisms, accelerating the volume of new sequence data.
Key terms
- protein signatures — an array of proteins expressed by a cell or tissue under a specific condition.
- DNA probe — a single-stranded DNA fragment that is complementary to part of the gene (DNA or RNA) of interest.
- autoradiography — the method of producing a photographic image from radioactive decay; in molecular genetics the method allows the visualization of radioactively-labeled DNA probes that have hybridized to a nucleic acid sample.
- Agarose gel electrophoresis — a method for separating populations of DNA molecules of varying sizes by differential migration rates caused by a voltage gradient through a horizontal gel matrix.
- Restriction fragment length polymorphism (RFLP) — a genetic variant identified by differing numbers or sizes of DNA fragments generated after digestion of a DNA sample with a restriction endonuclease; the variants are caused by the loss or gain of restriction sites, or the insertion or deleting of sequences between restriction sites.
- Southern blot — a technique in molecular genetics used to detect the presence of certain DNA sequences within a given DNA sample; DNA fragments within the sample are separated by agarose gel electrophoresis, immobilized on a membrane, and then exposed to a specific DNA probe labeled with a radioactive or fluorescent molecular beacon to aid in detection.
- northern blot — a technique in molecular genetics used to detect the amount of RNA made by gene expression within a tissue or organism sample; RNA fragments within a sample are separated by agarose gel electrophoresis, immobilized on a membrane, and then exposed to a specific DNA probe labeled with a radioactive or fluorescent molecular beacon to aid in detection.
- microarray analysis — a technique used to compare two samples of genomic DNA or cDNA; the DNA or cDNA fragments are immobilized on a chip and labeled with different fluorescent dyes, allowing for comparison of sequences or gene-expression patterns.
- polyacrylamide gel electrophoresis (PAGE) — a method for separating populations of proteins and DNA fragments during Sanger sequencing of varying sizes by differential migration rates caused by a voltage gradient through a vertical gel matrix.
- polymerase chain reaction (PCR) — an in vitro molecular technique that rapidly amplifies the number of copies of specific DNA sequences to make the amplified DNA available for other analyses.
- DNA primers — short, synthetic, single-stranded DNA fragments of known sequence that bind to specific target sequences within a sample due to complementarity between the target DNA sequence and the primer; commonly used in PCR but may be used in other hybridization techniques.
- Reverse transcriptase PCR (RT-PCR) — a variation of PCR used to obtain DNA copies of a specific mRNA molecule that begins with the conversion of mRNA molecules to cDNA by the enzyme reverse transcriptase.
- real-time PCR (quantitative PCR, qPCR) — a variant of PCR involving the use of fluorescence to allow for the monitoring of the increase in double-stranded template during a PCR reaction as it occurs, allowing for the quantitation of the original target sequence.
- Sanger DNA sequencing (dideoxy method, chain termination method) — the original DNA sequencing technique in which dideoxy nucleotides, each labeled with a molecular beacon, are used to terminate chain elongation; the resulting incrementally sized fragments are then separated by electrophoresis to determine the sequence of the DNA molecule.
- next generation sequencing — a group of automated techniques used for rapid DNA sequencing.
- 454 sequencing (pyrosequencing) — a next generation sequencing technique in which fragmented DNA has DNA adapters attached, is amplified by PCR, is attached to a bead, and then placed into a well with sequencing reagents, and the flash of light produced by the release of pyrophosphate on addition of a nucleotide is monitored.
Practice
Explain the use of nucleic acid probes to visualize specific DNA sequences
Why is it important that a DNA probe be labeled with a molecular beacon?
The sentence introducing the molecular tag names what it lets researchers do once binding occurs.The method of producing a photographic image from radioactive decay, used in molecular genetics to visualize radioactively labeled DNA probes that have hybridized to a sample, is called ________.
Named where the text describes how a radioactive phosphorus tag on a DNA probe is detected.A single-stranded DNA fragment that is complementary to part of a gene of interest and different from other DNA sequences in the sample is called a ________.
Name the artificially constructed piece of DNA introduced at the start of Nucleic Acid Probing.Explain the use of gel electrophoresis to separate DNA fragments
In agarose gel electrophoresis, DNA will be attracted to the negative electrode.
Recall the charge of DNA’s backbone and which electrode carries the opposite charge.To separate very large DNA fragments, such as chromosomes or viral genomes, agarose gel electrophoresis can be modified by periodically alternating the orientation of the electric field during ________.
Name the modified electrophoresis technique described for separating very large DNA fragments.A method for separating populations of DNA molecules of varying sizes by differential migration rates caused by a voltage gradient through a horizontal gel matrix is called ________.
Name the electrophoresis technique that uses a horizontal gel matrix, introduced at the start of this subsection.Explain the principle of restriction fragment length polymorphism analysis and its uses
Which technique uses restriction enzyme digestion followed by agarose gel electrophoresis to generate a banding pattern for comparison to another sample processed in the same way?
Name the technique in the Restriction Fragment Length Polymorphism subsection that compares banding patterns from digested DNA samples.All of the following techniques involve hybridization between single-stranded nucleic acid molecules except:
Recall which of these four techniques compares restriction-digest banding patterns rather than using a labeled probe to detect a complementary sequence.A genetic variant identified by differing numbers or sizes of DNA fragments generated after digesting a DNA sample with a restriction endonuclease is called ________.
Name the technique this whole subsection defines in its opening paragraph.Compare and contrast Southern and northern blots
The ________ blot technique is used to find an RNA fragment within a sample that is complementary to a DNA probe.
Name the blot variation used for RNA, distinguished from the Southern blot used for DNA.Which blot technique, developed by Sir Edwin Southern in 1975, is used to find a particular DNA sequence within a sample?
Name the technique after the scientist who developed it, described at the start of this subsection.In the dot blot, slot blot, and spot blot variations of the Southern blot, the amount of target DNA present in a sample is estimated by measuring the ________ detected after hybridization with a DNA probe.
Name the property of the probe’s signal that these Southern blot variations measure instead of running an electrophoresis gel.Explain the principles and uses of microarray analysis
In microarray analysis, what color would a spot on the microarray appear if only the sample labeled with the green fluorescent probe hybridizes there?
Recall what happens to a spot’s color when only ONE of the two labeled samples binds there, as opposed to both or neither.A technique used to compare two samples of genomic DNA or cDNA by immobilizing DNA or cDNA fragments on a chip and labeling the samples with different fluorescent dyes is called ________.
Name the hybridization technique described at the start of this subsection.What is the advantage of microarray analysis over northern blot analysis in monitoring changes in gene expression?
Show model answer
Did your answer mention:
Describe the methods used to separate and visualize protein variants
Which technique is used to separate protein fragments based on size?
Name the gel electrophoresis variation used for proteins rather than nucleic acids.When separating proteins strictly by size, why is exposure to SDS first required?
Recall what SDS does to a protein’s native charge before PAGE separates the sample.A variation of gel electrophoresis using a vertical gel apparatus, commonly used for separating proteins, is called ________.
Name the gel electrophoresis technique introduced at the start of this subsection.Explain the method and uses of polymerase chain reaction and DNA sequencing
The PCR step during which the double-stranded template molecule becomes single-stranded is called ________.
Name the first of the three steps in each PCR cycle, carried out at about 95 °C.The sequencing method involving the incorporation of ddNTPs is called ________.
Name the sequencing method introduced at the start of the DNA Sequencing subsection, also credited to the scientist who developed it.Why must the DNA polymerase used during PCR be heat-stable?
Recall which of the three PCR temperatures would destroy an ordinary, non-heat-stable polymerase.Suppose you are working in a molecular biology laboratory and are having difficulty performing the PCR successfully. You decide to double-check the PCR protocol programmed into the thermal cycler and discover that the annealing temperature was programmed to be 65 °C instead of 50 °C, as you had intended. What effects would this mistake have on the PCR reaction? Refer to the PCR figure above.
Show model answer
Did your answer mention:
A variation of PCR used to obtain DNA copies of a specific mRNA molecule, beginning with the enzyme reverse transcriptase converting mRNA into cDNA, is called ________.
Name the PCR variation described at the start of the PCR Variations subsection.The group of automated techniques used for rapid DNA sequencing that laboratories have used since 2005 is called ________.
Name the umbrella term for automated sequencing techniques introduced partway through the DNA Sequencing subsection.This section is adapted from Microbiology, Section 12.2: Visualizing and Characterizing DNA, RNA, and Protein by Nina Parker, Mark Schneegurt, Anh-Hue Thi Tu, Philip Lister, Brian M. Forster, and OpenStax, © OpenStax, licensed under CC BY-NC-SA 4.0. Access the original for free at openstax.org. Changes: the sixth objective’s source text (“Describe the methods uses to separate and visualize protein variants”) corrects the one-word grammatical error “uses” to “used,” logged as an erratum. All thirteen source figures are re-encoded as WebP and rendered as mediafigures; the media manifest guesses kind="photo" for all thirteen (every source file is a JPEG), which is correct only for the Lyme-disease rash photo and the PCR-ribotyping gel photo — the other eleven are explicit kind="diagram" because each is a genuinely drawn, labeled diagram (including the AgaroseGE, PAGE, and Ribo_Rep figures, which are composites of drawn panels and photographs). The AgaroseGE alt’s DNA-ladder sizes are corrected from the source’s “2000 bp, 15000 bp, 1000 bp, 750 bp, 500 bp, 250 bp” to “2000, 1500, 1000, 750, 500, 250 bp,” matching the ladder as printed in the artwork; the Microarray, ddNTP, and Ribotyping alts are rewritten from the image rather than the source alt, which respectively misspelled “reverse transcriptase” as “transciptase,” misspelled “dideoxynucleotide” as “Dideeoxynucleotide” and “also” as “aso,” and read “Javier’s an matches” instead of naming that Javier’s lane matches the reference lane above it — all four are known source-alt defects, logged. The Case in Point figure’s caption states “ribotype 27” while the gel image itself labels the matching reference lane “027”; this is a formatting difference rather than a factual error and is transcribed as printed. All seven body Check Your Understanding questions are rendered as body items at their note positions: three are graded (two multiple choice converted from the unkeyed “What does a DNA probe consist of?” and “On what basis are proteins separated in SDS-PAGE?” questions, each fixed by one module sentence and distractored from the module’s own vocabulary) and four are self-checks with model answers and rubrics assembled only from this module’s own sentences, because their honest answers require assembling more than one sentence or a paragraph-length comparison. The Critical Thinking question about a mis-programmed annealing temperature drops its dangling source cross-reference (“Refer to .”) and instead names “the PCR figure above” as a referent; its answer requires an inference the module does not state outright, so it stays a self-check. Of the module’s nine keyed source exercises, all three Multiple Choice, the one True/False (rendered as a two-option multiple choice), and two of the three Fill in the Blank items are adapted into Practice unchanged; the third Fill in the Blank (“Sanger sequencing, dideoxy method, or chain termination method”) is rendered as a textin keyed to “Sanger sequencing” with the other three source-printed phrasings and “Sanger method” as accept alternates, each verified against the real text grader. Of the module’s six unkeyed Short Answer and Critical Thinking questions, two Short Answer questions are graded as multiple choice from a single module sentence each (why a DNA probe needs a molecular beacon; why PCR’s DNA polymerase must be heat-stable) with distractors built from this module’s own vocabulary; the “advantage of microarray over northern blot” Critical Thinking question needs two sentences (the northern blot definition and the microarray-capacity sentence) and stays a self-check; the “difference between RT-PCR and qPCR” Critical Thinking question is not converted because it would re-ask, in the same words, the body Check Your Understanding bullet “Compare RT-PCR and qPCR in terms of their respective purposes” that already covers the identical fact — both remain self-checks rather than duplicating one fact as two items. Ten term-recall textin items and three body-sentence cloze fillers (a PFGE cloze, a dot/slot/spot-blot signal-intensity cloze, and the negative-to-positive electrode direction tested only via the True/False conversion) round out the Practice floor; the signal-intensity cloze replaces an earlier northern-blot cloze that duplicated the Fill in the Blank item’s key within the same Practice group. Key terms are compiled from the module’s 19 defined <term> elements and the book’s Glossary appendix, rendered as 16 bullets: chain termination method, dideoxy method, and Sanger DNA sequencing method have no distinct appendix entries of their own and share one merged bullet, Sanger DNA sequencing (dideoxy method, chain termination method), with its meaning taken from this module’s own defining sentence; real-time PCR and quantitative PCR (qPCR) are likewise combined into one bullet under the appendix’s own merged headword. Feature boxes are rendered as callouts: both Link to Learning boxes in the DNA-analysis portion and the one in the sequencing portion keep their external links; the Case in Point box (with its footnote rendered as an inline parenthetical citation) keeps its two closing questions as unanswered plain bullets at their document position, before its two figures, exactly as printed. Clinical Focus Part 2 names Part 3 as continuing later on the same page and names Microbes and the Tools of Genetic Engineering as where the case began; Clinical Focus Part 3 links the case forward to Whole Genome Methods and Pharmaceutical Applications of Genetic Engineering, names Part 2 as appearing earlier on this page, and names Microbes and the Tools of Genetic Engineering as where the case began, regardless of which earlier Clinical Focus part the source’s own “previous” link points to. The cross-reference to the thermal cycler photograph in the chapter introduction (m58847) is rendered as a link to the chapter landing page. All instances of the prime mark in 3′-hydroxyl are normalized to the Unicode prime (′). The year of Sanger’s dideoxy chain-termination method is corrected from the source’s 1972 to 1977 with a visible Source note (Sanger, Nicklen, and Coulson, 1977).